PR data were acquired on the 3 east-bound lanes of a 90 meter long bridge using a Noggin 1000 GPR in a SmartChariot vehicle-towed configuration. Three lines were collected in each lane: in the Left Wheel Path (LWP), Right Wheel Path (RWP) and the Center (CTR). This provided 9 lines with a total of approximately 810 meters of GPR data on the bridge.
A GPS was connected to the GPR system, enabling all data to be accurately geo-referenced. The positions of the survey lines are displayed in the following Google Earth image. The degree of salt-induced corrosion of reinforcing is a major concern with concrete decks and similar structures in northern climates where de-icing salt is used. Since the presence of saline water and corrosion by-products causes strong attenuation of GPR signals, GPR attenuation has become an accepted indicator for rapid, non-invasive evaluation of concrete structures.
The combination of high resolution, high quality GPR data combined with a standardized workflow and advanced but easy to use software mean professional results can be obtained the same day and at an affordable cost.
The odometer triggered data acquisition every 3 centimeters (about 1.25 inch) for a total of about 27,000 unique sample points on the bridge deck. Data acquisition took less than an hour – in fact more time was spent driving to the next exit and turning the tow vehicle around to collect another pass of the data then was spent actually acquiring the bridge data.
| Bridge Length | Number of GPR Lines | GPR Data Length | Step Size | Total number of samples | Acquisition Time |
|---|---|---|---|---|---|
| 90 m | 9 | 810 m | 0.03 m | about 27,000 | <60 min |

A cross-section of a portion of one line is shown below. The data show that the rebar spacing on the bridge deck is 25 centimeters (approximately 10 inches).
Using the EKKO_Project interpretation module, the hyperbolic responses from the rebar were picked – the Smart Point feature was used to pick the best position of each rebar (red dots).
The degree of salt-induced corrosion of reinforcing is a major concern with concrete decks and similar structures in northern climates where de-icing salt is used. Since the presence of saline water and corrosion by-products causes strong attenuation of GPR signals, GPR attenuation has become an accepted indicator for rapid, non-invasive evaluation of concrete structures.
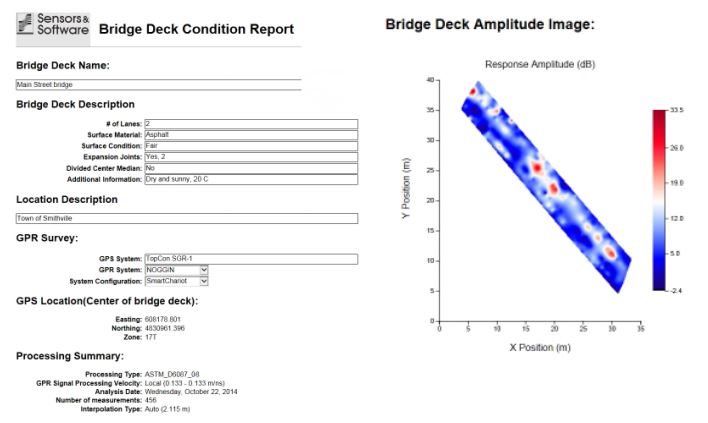
The EKKO_Project software includes the ability to process the rebar amplitude values and create signal attenuation map images. Two types of Response Amplitude displays are available; raw amplitude yields GPR signal strength in millivolts (mV) while a normalized display presents the data in decibels (dB). The latter map is often referred to as a Deterioration Index map. The 'dB' map uses an enhanced version of the processing outlined in ASTM standard 6087 for GPR data on asphalt-covered bridge decks.

The EKKO_Project map image provides the option to change the Color Palette and amplitude range.
The rebar data also provide useful statistics including the minimum, maximum and average amplitude, rebar depth and rebar spacing – see the tabulated summary below. This information is especially important to civil engineers.
| Minimum | Maximum | Average | |
|---|---|---|---|
| GPR Amplitde (dB) | -5.007 | 39.845 | 5.795 |
| Reinforcement Depth (m) | 0.120 | 0.204 | 0.164 |
| Reinforcement Spacing (m) | 0.149 | 2.010 | 0.254 |
The EKKO_Project module outputs the map image in a report format with several fields for the GPR operator to fill in including the survey location, number of lanes and the GPR system used (see image below). The report can then be printed directly or to a PDF document.

Despite its name, the Bridge Deck Pavement Condition Report is not restricted to bridge decks; any concrete structure with reinforcing such as concrete highways, bridge piers, multi-level parking garages, warehouse floors etc. can be surveyed with GPR and processed in this way to assess their condition. Further, GPR data can be collected with variety of GPR system configurations such as the hand-pushed SmartCart, the hand-towed SmartTow or a hand deployed system like Conquest can be used.
Download the case study: Bridge Deck Condition Reports
Click here and learn more about Noggin GPR and EKKO_Project™ software.


