
IceMap™
Accurate, real-time ice thickness measurements for mapping and ice management


The Sensors & Software IceMap™ GPR system is designed to measure the ice thickness at driving speeds to provide real-time, continuous ice thickness measurements to identify areas of thin or problematic ice as part of ice safety programs.
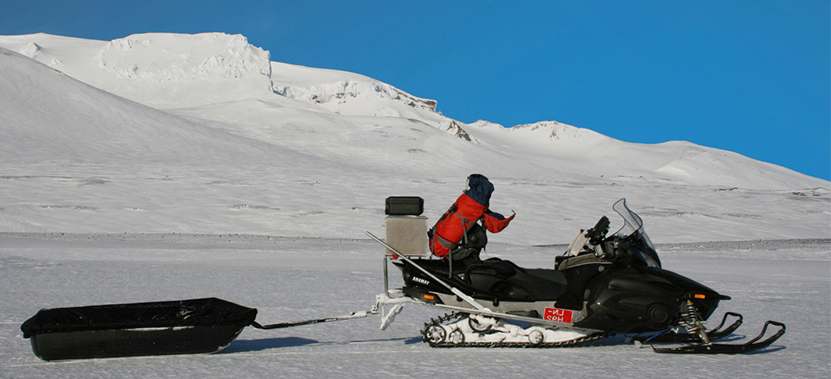
The GPR-based ice thickness sensor is housed in a toboggan that is towed across the ice surface behind a truck or snowmobile. The ice thickness data is sent wirelessly from the sensor to the operator’s computer and displayed in real-time as a cross-sectional image.
The current ice thickness under the sensor is displayed numerically and graphically. As well, the minimum and maximum ice depth values for the current line are displayed. An alarm sounds when the ice drops below the user-defined minimum ice thickness value.
Rapid data acquisition enables the unit to be towed at speeds up to 80 km per hour (50 mph).

Continuous Measurements Help Identify Areas of Thin Ice
Many districts now require that GPR is used as part of a complete ice safety program and recognize that the large intervals between ice coring increases the risk that a dangerous area of thin ice will go undetected. IceMap can continuously measure ice thickness, at intervals as small as 5 cm (2 inches). These high-density measurements help ensure that the thinnest areas of ice have been detected and can be used in ice road weight capacity calculations.


Benefits of IceMap

IceMap Data Collection Software
To collect IceMap™ data, the user simply sets the desired vehicle speed (in km/h or mph), scan depth and step size (measurement interval). All other parameters are automatically optimized for best quality data.

Data Editing
After collecting IceMap data, the operator can click on a Toolbar button to edit:
User defines the area to delete picks or repick by dragging the box edges on the touchscreen

Ice Thickness Reporting
Reports in PDF format are quickly generated from the IceMap™ data:
- Users can define the survey name, start and end location, and any additional comments
- Ice Calibration summary lists the IceCals performed; their location and the measured thickness of ice
- A table of the thinnest ice sections including the total length and the longest continuous section of thin ice
- An Exceptions table plots the areas where picks were manually removed; these areas might indicate grounded ice
- A map view display of the IceMap™ line
- An overview cross-section of the ice thickness for the IceMap™ line
- Detailed cross-sections of every 1000 meters of the IceMap™ line
PDF Reports


Google Earth KMZ Report

Spreadsheet CSV Report

Save ice thickness information to a spread sheet CSV file to import into GIS (Geographical Information Systems) and CAD software.

Contact Us
Case Studies
GPR & Arctic Oil Exploration
Arctic oil exploration requires safe transportion of heavy equipment over ice-covered areas. Use of seismic vibrator sources demand that safe ice thickness be assured and quality of data can depend on finding grounded ice. This case study follows the evolution of the IceMap system now widely used for ice thickness mapping.
Learn more


