
LMX150™ for Utility Locating


LMX150™ GPR complements traditional pipe and cable locators and allows you to locate targets below the surface such as:
- Metal utilities, including pipes and cables
- Non-metallic pipes, including PVC and asbestos cement
- Concrete storm and sewer systems
- Utilities where installed tracer wiring has failed
- Underground storage tanks and drainage tiles
- Septic system components
- Fiber optic cables
- Non-utility structures such as vaults, foundation walls and concrete pads

In-field visualization features

Interpretations
Classify your targets in real time with field interpretations. Simply touch the screen and select from a range of color-coded options.
Dynamic Target Enhancement (DynaT™)

DynaT™
DynaT™ is our patented Dynamic Target enhancement feature that optimizes views of small, medium and large targets. These views can be toggled to reveal additional subsurface features, giving you unprecedented insights and target confidence in the field.
Grid Scan Mode

Simple grid setup and guided grid collection on the display unit
Select from 4 standard grid sizes. The system guides you through the grid setup and collection.

Flexible grid line collection with added Obstacle Avoidance feature
The system guides you through collecting a grid around an obstacle. You can also collect odd shaped grids by just ending lines short or skipping lines altogether.
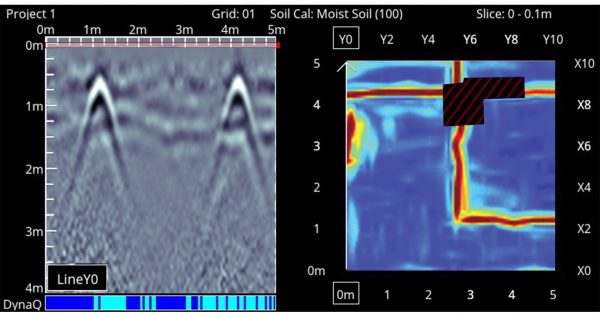
SliceView
Generate depth slices from both complete and incomplete grids in the field at the touch of a button.
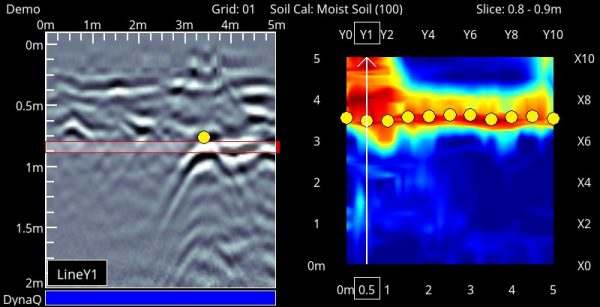
View, save and share your collected grid in the field
View grid lines, flags or field interpretations that were collected in conjunction with the depth slice image on the right. You can then at a glance correlate your interpretations to depth slice images.
Additional Capabilities with External GNSS

SplitView
Combines the benefits of LineView and MapView onto one screen. The MapView side of the screen shows all the GPR data that has been collected and where the LMX150™ is currently located in the survey area while the LineView side displays your cross-section data to quickly see the spatial relationship between targets and determine if a series of hyperbolas are in linear orientation.
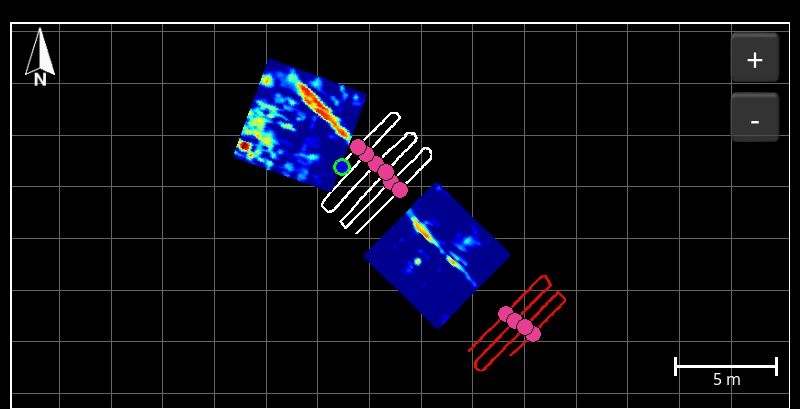
MapView display
Display a powerful and meaningful bird’s eye view of your site map with survey path, depth slices, field interpretations, flags and collected lines in MapView

MapView Layers
Toggle on and off multiple layers to optimize your view to generate a more complete picture of your full site, and capture in screenshots to augment your reports right from the display unit
Numerous data export possibilities

Easily review and share captured screenshots in Wi-Fi mini reports
The Screenshot Gallery displays a Tile View of screens saved by pressing the Camera button. Select a screenshot to email it in a mini-report.

Share findings quickly directly from the field
Produce instant reports from your display unit that includes screen captures of line, grid and MapView information.

Field Interpretations file (.CSV)
Interpretation information added in the field are automatically saved in a CSV file that contains depth, position and GNSS coordinates.
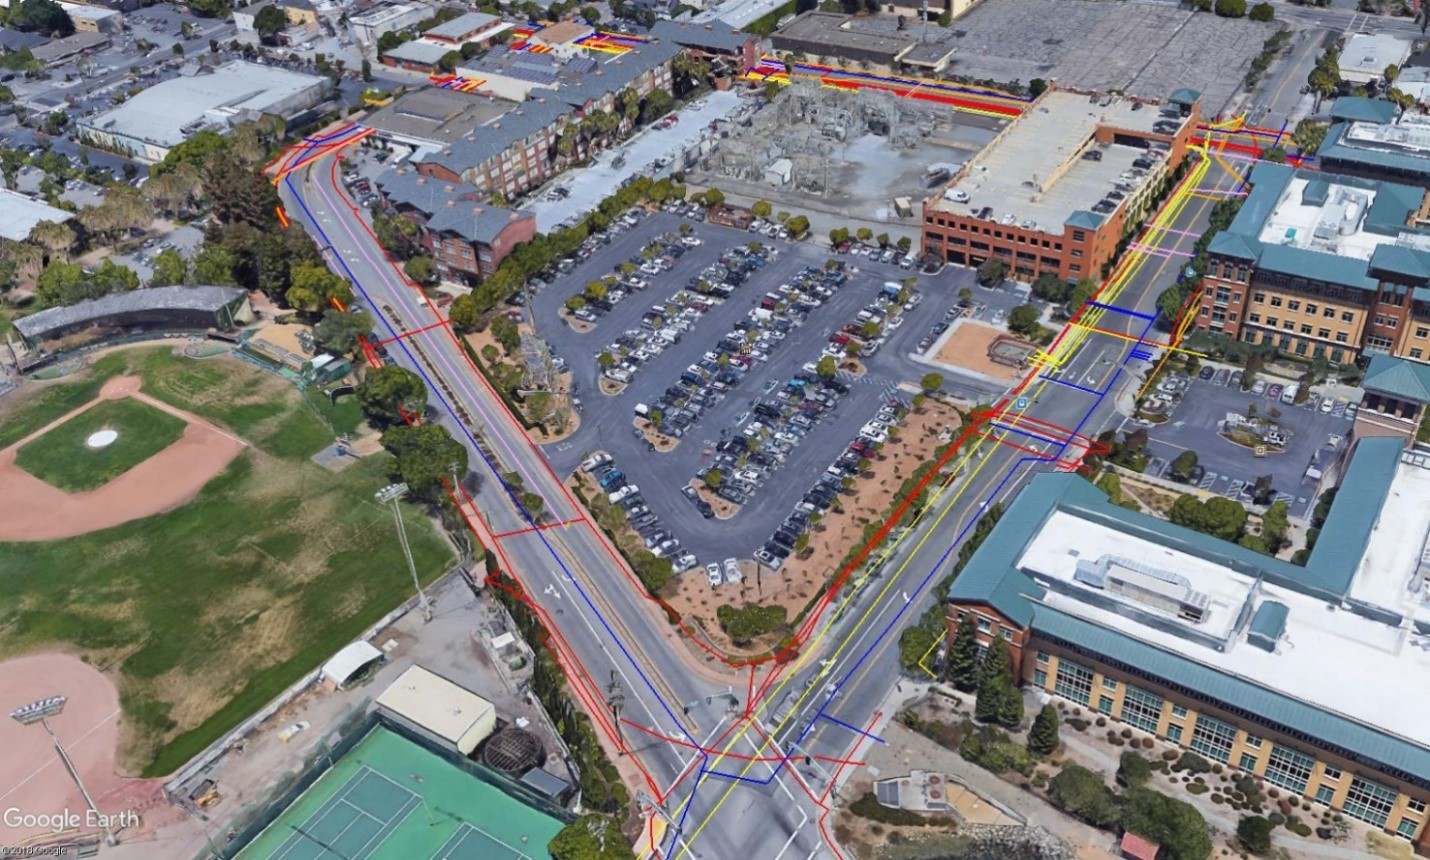
Google Earth™ files (.KMZ)
Survey paths and field interpretations are automatically exported to .KMZ files for viewing in Google Earth™. Generate stunning utility maps by plotting interpretations on GIS or aerial images and connecting them to show the utility paths.

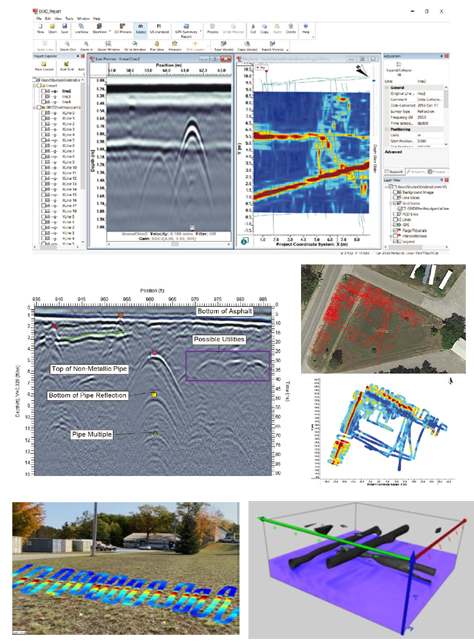
The LMX150™ allows you to export GPR data and use the powerful EKKO_Project™ GPR software to visualize, analyze and report on your data.
EKKO_PROJECT™ PC software
Visualize, Understand and Report your GPR results with optional EKKO_Project™ PC Software
- Organize GPR data, photos and other files as a single project (.GPZ file)
- Easily create PDF GPR summary reports of your findings.
- Add interpretations, photos, audio & video to GPR lines.
- Create depth slices with or without a grid.
Explore the many options for data visualizations and analysis with EKKO_Project software bundles.
Contact Us


