Since 2012, EKKO_Project software has been the foundation for organizing, viewing and analyzing GPR data and generating impressive deliverables that suit your project requirements. The latest software update, version 6, continues to improve EKKO_Project by adding powerful visualization tools for data analysis and reporting.
What’s New in EKKO_Project V6?
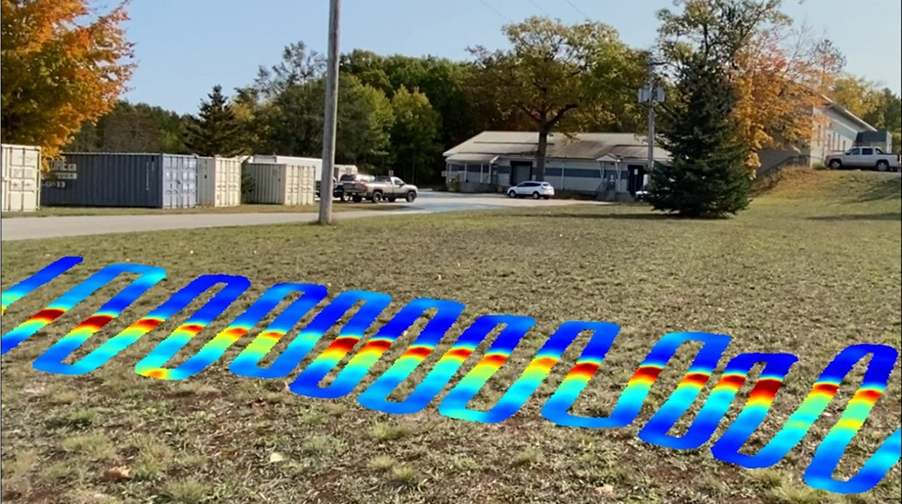
PhotoSlicer allows the user to easily overlay depth slice images onto a photo. Depth slices generated on the display unit in the field, or from EKKO_Project’s SliceView software module, are stretched or squeezed to fit onto the photo in the proper position and with the proper perspective.
Then, the user can scroll through the depth slices to create stunning visualizations of the GPR data. PhotoSlicer is available in the base version of EKKO_Project.
PhotoSlicer images are powerful additions to the GPR Summary Report and presentations (Figure 1) to convey the position of objects found with GPR, in the context of the survey site.
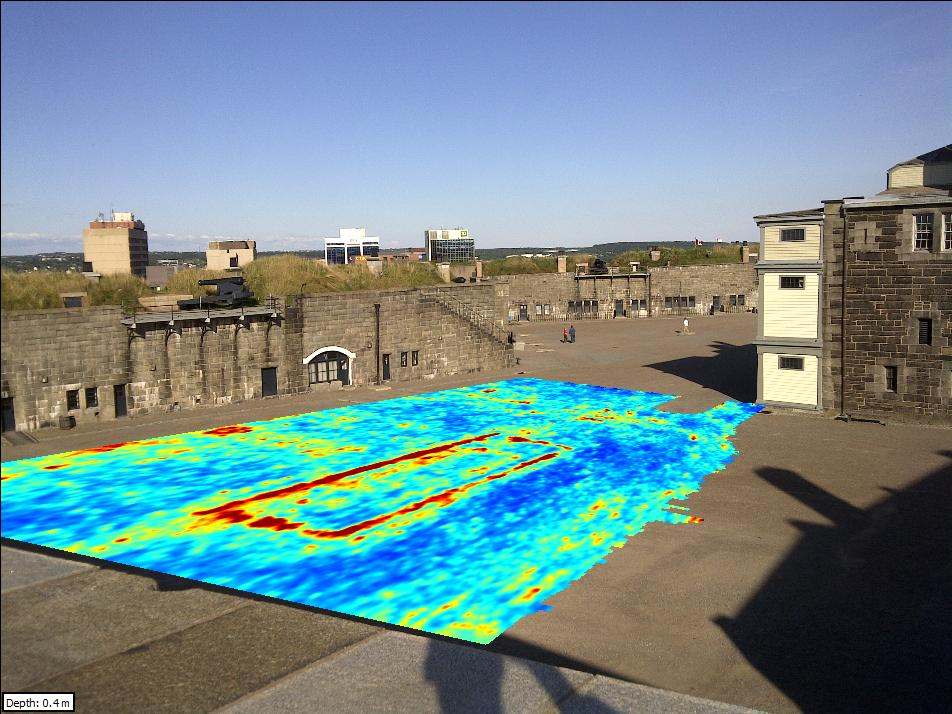
Automatic 3D display in Voxler: Seeing a 3D image of your GPR results is a great way to visualize data and adds a professional flare to your results. You can now export, in a single click from SliceView-Grid, the files needed to visualize your data in the 3D tool, Voxler. Voxler is third-party software for 3D visualization. When SliceView-Grid users save a Grid Scan to 3D, the Voxler program now launches and automatically generates 3D images with pre-set parameters for the following types of 3D displays:
• Volume Render (Volrender) displays the whole cube of data and allows the user to modify the transparency to highlight GPR reflections of certain signal strength. For example, it is common to make weak GPR reflectors transparent and only display the strongest reflections in the data.
• ClipPlanes slice through the cube of data, like depth slices but with the advantage of slicing at any angle through the data cube.
• Isosurfaces show all the points of a single, user-defined GPR amplitude value in the cube with all other data transparent; great for showing the strongest reflectors in the data (Figure 2).

The user can then easily edit the display properties and optimize the 3D image.
This seamless new capability eliminates the need to generate 3D images in Voxler from scratch and gives users a headstart on making impressive 3D displays of their GPR grid data.
Generate Animation Files: EKKO_Project users can now easily create GIF animations. These animations can be used to help spot features in your GPR data as part of analysis, as a marketing tool on your website, or as a value-add deliverable to send to your clients along with the PDF Summary Report and Google Earth Files.
GIF animation files play on standard, pre-installed Windows programs such as Windows 10 Photo Viewer making them easy deliverables to share with others.
Animations can be created from 3D Preview, where the user can select the X lines, Y lines or depth slices to animate while the other two dimensions remain fixed on a userselected image (Figure 3). Animations can also be created from MapView to animate one or more depth slices with interpretations, background images, lines, GPS path, and flags also visible (if desired).

Multi-media Flags: Flags are added to GPR data in the field and post-processing to mark the position of surface features or objects in the GPR data to assist with the data interpretation, positioning and data documentation. An example is flagging the position when the GPR system moves from one type of surface material to a different type (for example, grass to pavement) because this change can affect the GPR response and impact the interpretation of the data.
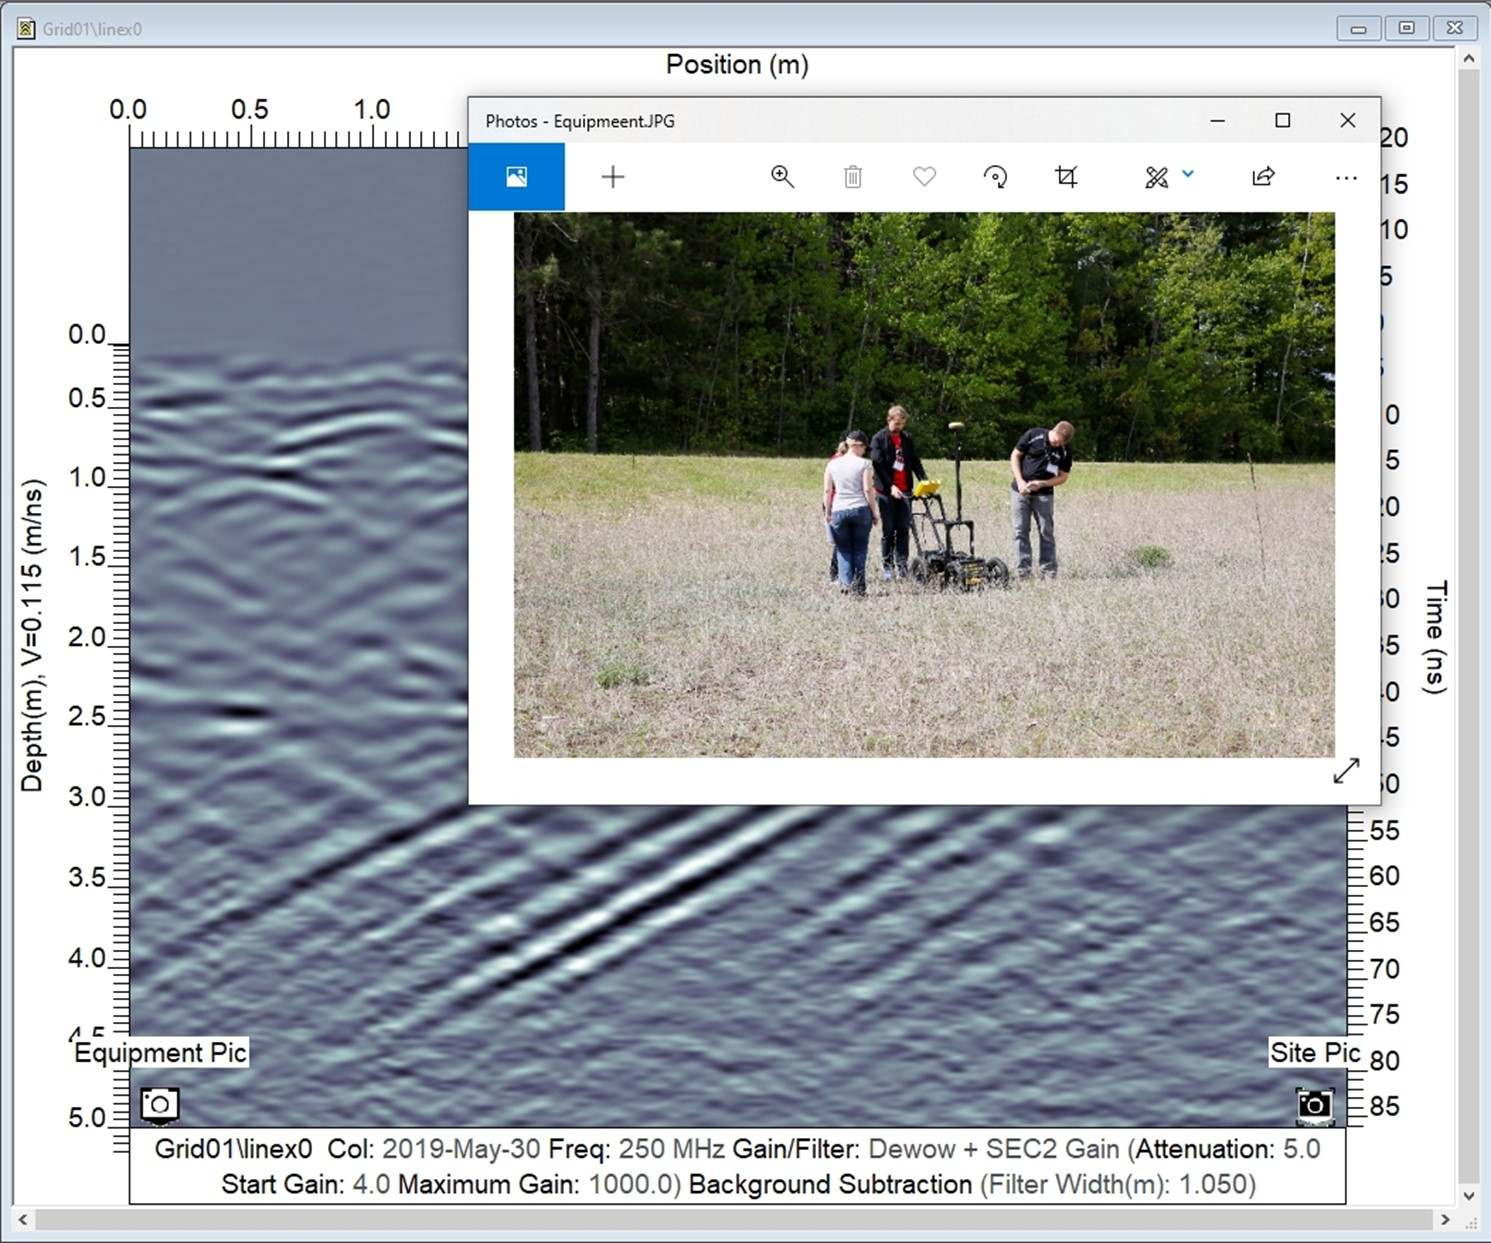
EKKO_Project V6 adds a new feature to the Interpretation module: multi-media flags, which combine flags and multimedia file attachments. EKKO_Project already allows GPR users to attach auxiliary data files such as photos, videos, audio files and field notes to grids, individual GPR lines or to the project but associating them with a specific location in the GPR data could not be done. With this new feature, users can now attach photos, videos, and audio files to a flag, creating a multi-media flag with the appropriate icon on it (Figure 4). This provides an easy way to transfer field notes to a specific location in your data and provides a complete archive of your results to be used when analysing your data.
Examples of the use of multi-media flags are attaching a photo or video to a flag to show a surface feature you passed while collecting data or attaching a voice memo providing more information about the flag.
Clicking on the flag automatically opens the file attached to it; Figure 5 shows an example of a photo flag.
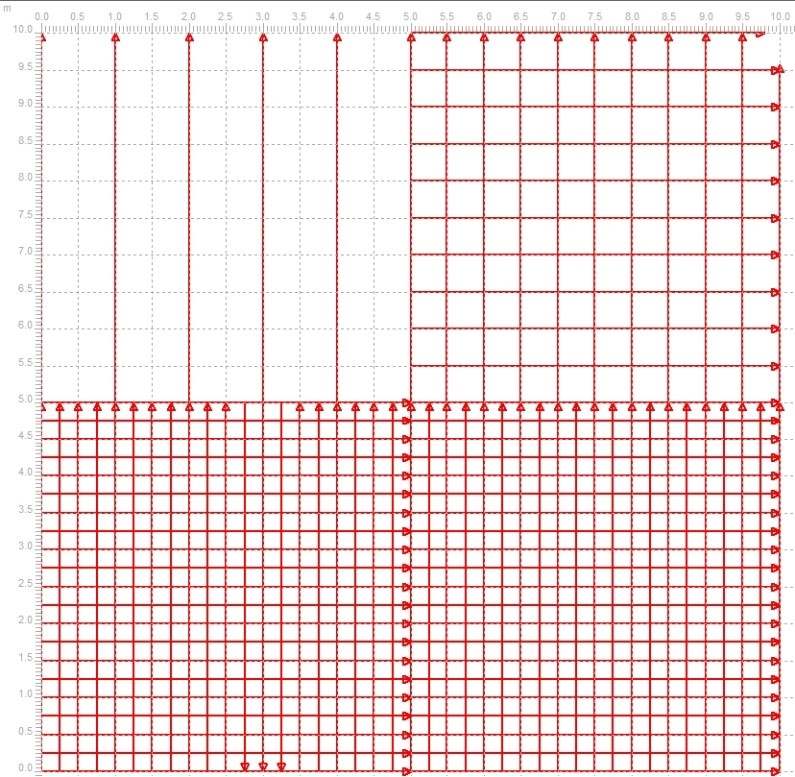
Grid Editing: For various reasons, GPR grid data often needs to be edited; whether you want to merge multiple grids collected over a large area into one large grid for data processing or combine parallel Line Scans into a grid for SliceView-Grid processing, or perhaps you need to correct a mistake made during field collection. You can now do so quickly in EKKO_Project. Grid editing (Figure 6), formerly the GFP_Edit utility, is now part of EKKO_Project with the three most common types of edits available:
• Create a new grid from a series of lines
• Edit an existing grid and
• Add lines (including another grid) to a grid.
By combining your data into grids, you can make use of SliceView-Grid data visualization tools.
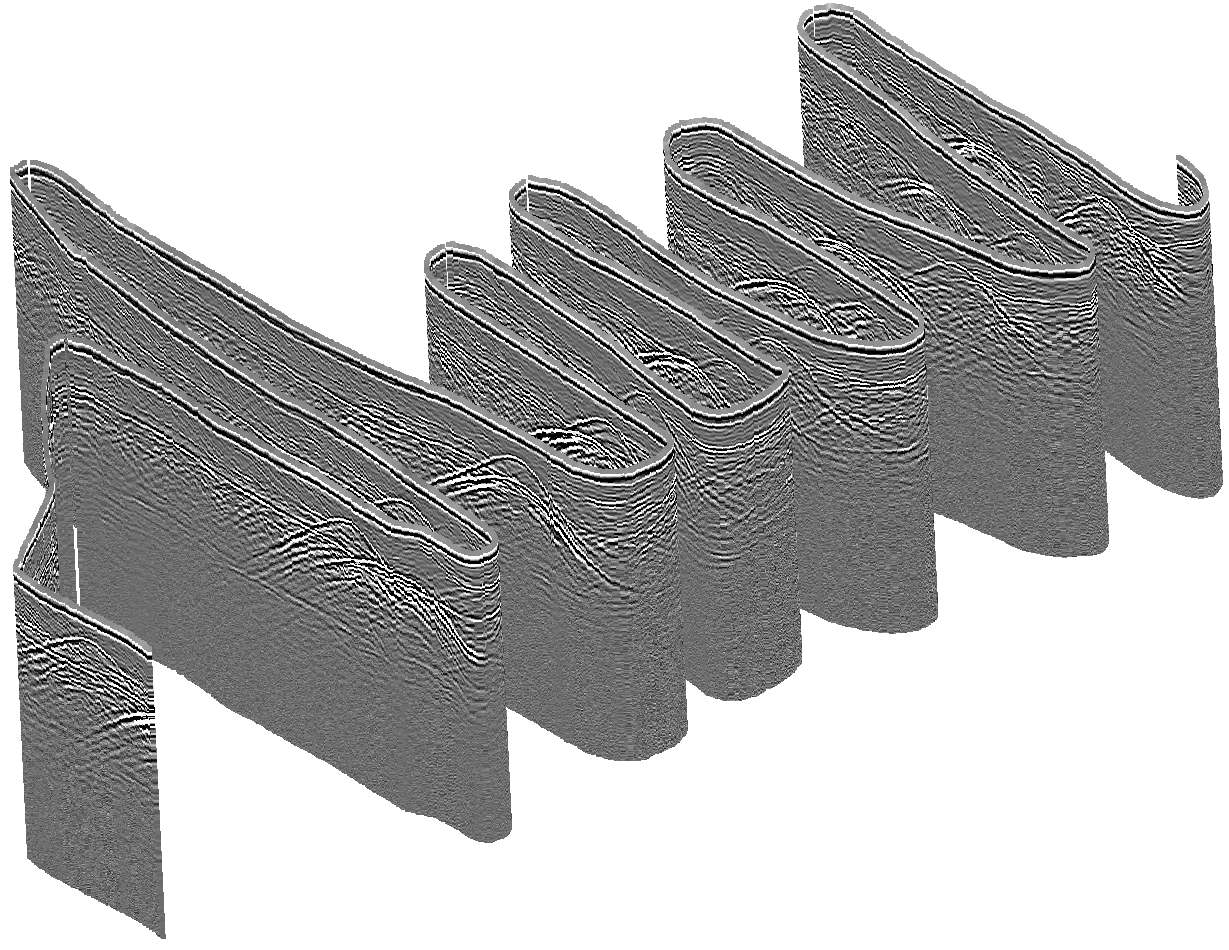
Data Export to point cloud: Third-party point cloud software can be used for plotting very large scientific data sets. Originally developed for LiDAR, 3D Laser scans and photogrammetry, point cloud visualization software can be a useful tool for visualizing GPR data collected with GPS. EKKO_Project now includes a new point cloud CSV file export option so GPR data can easily be imported into point cloud software. For example, Figure 7 shows a GPR line zigzagging over two utilities (indicated by hyperbolas) plotted in CloudCompare, a free to use 3D point cloud processing software.
Upgrade to EKKO_Project Version 6.


