celand is the island of fire and ice in the North Atlantic Ocean. The island is volcanically active (remember the eruption of the Eyjafjallajökull volcano in April, 2010 that disrupted air traffic across the Atlantic and Europe for days) but glaciers cover about 11% of the country.
Iceland generates 99% of its energy from renewable sources: hydroelectric and geothermal. Landsvirkjun (The National Power Company) is one of the largest producers of renewable energy in Europe and its total electricity generation in 2011 was 12,485 Gigawatt-hours. Landsvirkjun operates 14 hydroelectric power stations all over Iceland in five separate catchment areas. Glaciers play a critical role in hydroelectric power production in Iceland.
Over 70% of energy is produced with hydroelectric power generated by glacier and snow melt fed rivers. The melt water from snow and glaciers is stored in reservoirs and diversions during the summer (see Map) and utilized over the winter, when inflow is low. Knowing the amount of snow accumulated in the catchments by late winter is vital for spring inflow estimates for reservoirs. Calculating melt water volumes early provides time to make adjustments, if needed, to the annual plan for power generation so Iceland’s power requirements are met, without interruption.
The Icelandic highlands are in a maritime climate resulting in a complex snowpack structure with high variability in spatial snow distribution. For the past 25 years Landsvirkjun has annually surveyed glaciers for mass balance using conventional methods but has now added surveying of snow-on-land to the monitoring program.
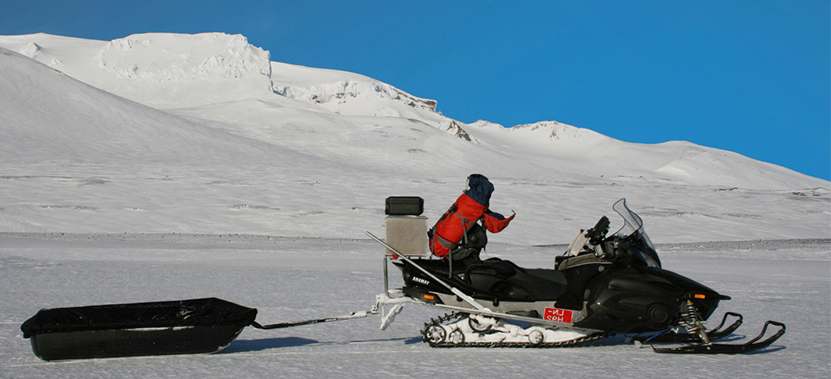
In spring 2015, a Software & Sensors IceMap™ system was used to provide snow thickness data from the catchments both on and off glaciers, adding to the knowledge of snowpack extent and winter snow accumulation. The IceMap™ system consists of a Noggin® 500 GPR sensor and an integrated GPS housed in an environmentally-sealed box strapped on a toboggan and towed by snowmobile. Data is sent wirelessly to a rugged laptop positioned near the snowmobile operator to allow real-time monitoring of the data.

In total, 65 cross-sections were surveyed on land to assess snow thickness and spatial distribution in the three main catchment areas. Periodically, snow pits were dug to validate the GPR data, calibrating for depth and for snow-water equivalence calculations.
After a successful snow-on-land campaign, the program was expanded for assessment of snow accumulation on glaciers for comparison with conventional methods. Figure 1 shows a GPR section on Tungnaárjökull glacier at 1500 m a.s.l. and the snow pit and ice core for the same location.
So far only point data has been obtained for snow-on-land thickness estimations but in future it looks like, by using the IceMap system, a spatial representation is much more feasible and, decisions regarding operation of the hydroelectric system will be based on more reliable and representative data. Snow distribution on land in Iceland can be very uneven within small areas so the data provided by IceMap™ makes a large difference in accurately estimating water volumes for hydroelectric power generation.
It is not an unreasonable interpretation to suggest that each hyperbola indicates the position of a grave. However, once a grid of data lines was collected and processed into depth slices, an interesting, unexpected pattern emerged that caused the operators to change their initial interpretation of the data. The 20 × 10 meter grid was collected in a few minutes by collecting 21 parallel lines, each 20 meters long and spaced 0.5 meters apart. Looking closely, the hyperbolic responses seen in the GPR line do NOT correspond with the grave responses in the depth slice. In fact, the hyperbolas are actually strong responses between the graves, while the graves in the depth slice are caused by weaker (low amplitude) GPR responses.
Figure 2 shows the GPR line at 3.5 meters that runs over top of several graves. Examining the cross section reveals that there is a strong scattering layer at about 0.7 meters depth. The GPR reflections from this layer, visible between the graves, were initially thought to be the responses from the graves.

Figure 2 – GPR section from Tungnaárjökull glacier. The interface between the summer firn and winter snow can be seen at ~ 7.0 m depth. A large ice lens is observed at ~6.2 m depth which was formed after a large rain-on-snow event. Distributed in the snowpack, ranging from the surface to about 6 m depth, various ice lenses are observed from small rain-on-snow events or melt events from rapid increases in temperature.
Click here to learn more about IceMap™ Ground Penetrating Radar.


