By Doria Kutrubes
Radar Solutions International
Introduction
Cranberries have been produced in the USA for almost two centuries. They are an unusual crop in that they grow best in bogs, which consist of fresh water underlain by layers of sand, peat, gravel, and clay. Over the decades, many bogs were artificially created by flooding areas for the purpose of cultivating cranberries. Now, for environmental purposes, some jurisdictions are working to restore former cranberry bogs to their natural, pristine conditions.
Radar Solutions International (RSI), Inc. conducted a series of ground penetrating radar (GPR) surveys to map stratigraphic layering at four different former cranberry bogs, totaling over 60 acres. The subsurface information derived from the GPR survey is being used as part of a local environmental restoration program.
Survey Methodology
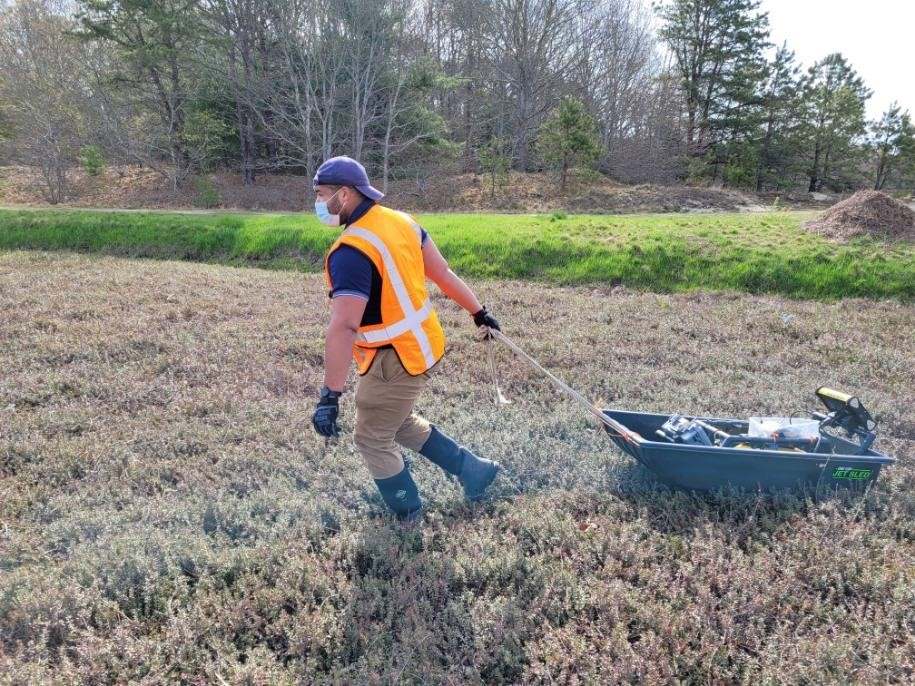
RSI used Sensors & Software’s NOGGIN® 250 MHz GPR system, and synchronized it with a sub-centimeter GPS, which provided real-time geo-referencing of our GPR traverses (Figures 1 and 2).

The seamless integration of the NOGGIN® 250 and our GPS, enabled our field crew to be extremely productive, allowing RSI personnel to focus exclusively on data collection, rather than spending time setting up a survey grid. We found that, compared to previous GPR service providers tasked with surveying the bog with older GPR equipment from another manufacturer, we could collect five times the data in a single day. Using GPR-GPS synchronization, the maximum line spacing throughout each cell in these bogs, was no greater than 10 to 15 feet apart (Figure 2). The high data density provided confidence in the conditions between GPR lines.
Synchronizing the GPS with the GPR also saved post-processing time, as GPR lines did not have to be assembled into a grid file using the GFP_Edit utility software, as their positions were already georeferenced.

The other advantage of the NOGGIN®, is that it allows the real-time “stacking” of GPR signal, increasing the overall investigative depth of the GPR compared to older GPR systems.
Interpretation
At this site, the highest-amplitude reflections occurred where there was a lithologic change, such as between the sand fill, added by the cranberry farms, and native peat layers beneath. Low to high amplitude internal reflections were also observed within the primary peat layer, which occurred where there is a sudden change in silt/sand content, possibly caused by a flooding event (Figure 3).

To map the depth of the lithologic layers, it was necessary to obtain an accurate velocity of the GPR signal through the saturated layers. GPR velocity varies with mineralogy and water content and is often extracted by fitting a curve to a hyperbola in the GPR data. However, in this case, there were no hyperbolic responses in the GPR data to work with.
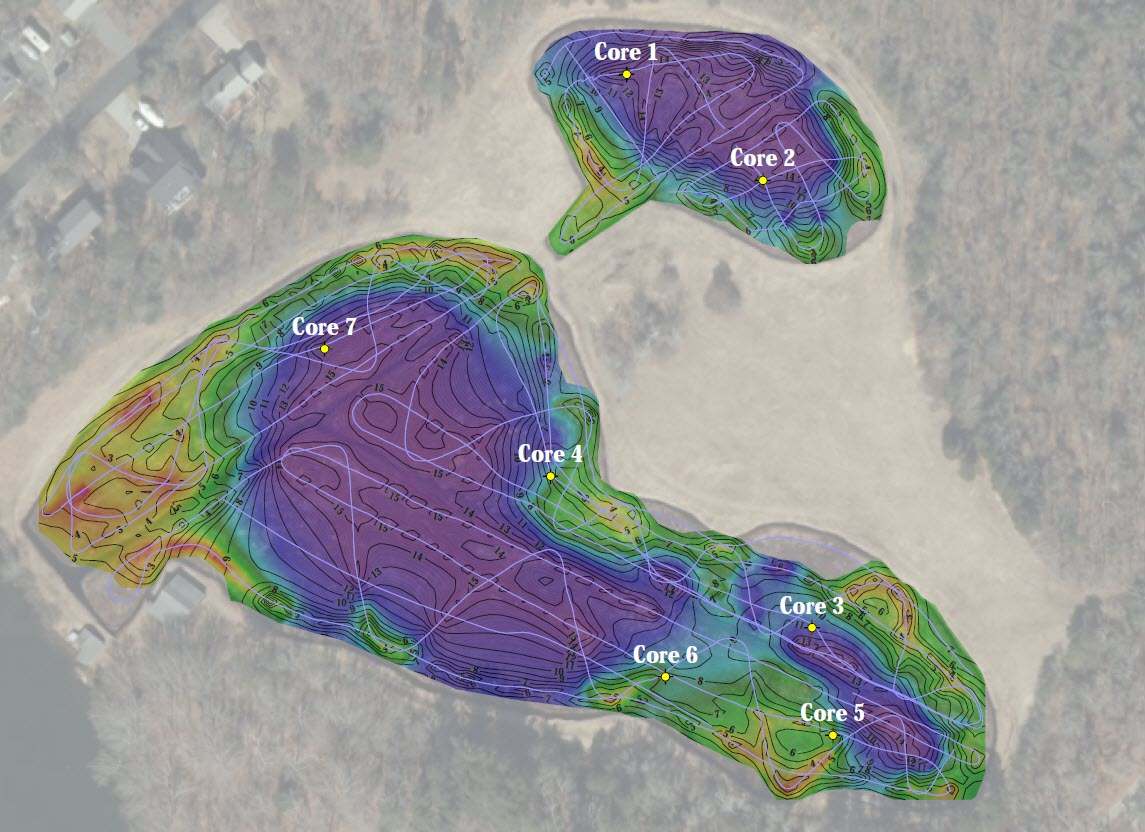
Another method to determine the GPR velocity is to correlate a lithologic layer of known depth to a reflector in the GPR data. To do this, cores were drilled using a hand-auger at 7 locations throughout each bog (Figures 4 & 5). By correlating the lithologic layers observed in the cores with reflectors seen in the GPR data, the velocity of the GPR signal through the mostly saturated sand/fill and native peat was determined to be about 0.235 ft/ns.
GPR cross-sections were interpreted using the EKKO_Project™ (V5 R3) GPR data analysis software, created by Sensors & Software. Using the Interpretation module, we were able to identify, and “pick” layers attributed to the sand-peat interface, as well as the interface between the bottom of the peat and deeper glacial/depositional material.
RSI extracted the depths of each picked layer as a GPR Project Report spreadsheet (CSV) file and created contour maps of thicknesses and depths using the SURFER© program, created by Golden Software, Inc. (Figures 4 & 5).
Results
Interpreted GPR results from multiple bog sites show that the longer the cranberry bog was in operation, the thicker the sand topping the peat. Typically, the sand ranged between 1.5 and 3 feet in thickness, but in some areas, the sand was more than 5 feet (Figure 4) .

We also observed that typically the peat was more than 16 feet in thickness in the center of the bog and tapered to only a few feet in thickness at the edges (Figure 5).

Summary
The GPR survey of the former cranberry bogs was very successful. The fresh water in the bogs had low TDS (total dissolved solids) and the sediments, low electrical conductivity. This allowed the NOGGIN® 250 GPR signals to penetrate to depths greater than 20 feet – GPR depths that are not typical in many materials. The detailed information that RSI discovered about the current state of the bogs proved invaluable to begin the planning process of returning them to their natural state.
Sensors & Software loves to share our customers’ GPR stories! Customer stories, like this one, are always popular, but note that the details and descriptions are those of the authors and Sensors & Software has not edited except for typographical errors.
If you have a GPR topic of interest to share, please contact us and submit your suggestions.


