


r. Mette Kusk-Gillespie shares the story of a field trip to Antarctica where she helped collect pulseEKKO® 25 MHz center frequency Ground Penetrating Radar data on glaciers and ice sheets to the astonishing depths of 850 and 1125 meters.
Sensors & Software loves to share customer stories in our newsletter! The details and descriptions are those of the author and Sensors & Software has not made any edits except for typographical errors. If you have a GPR topic of interest to share, please contact us and submit your suggestions.
Although I am now a more seasoned geophysicist, the data I helped collect in 2008 during my PhD studies at the University of Canterbury in New Zealand still holds an honorary place in my office at the Western Norway University of Applied Sciences. It reminds me of three weeks spent on the magnificent Darwin and Hatherton glaciers in Antarctica (Figure 1) with a 25 MHz Sensors & Software pulseEKKO® GPR system (Figure 2), visualising internal layers in snow, firn and ice, and mapping deep glacier beds.


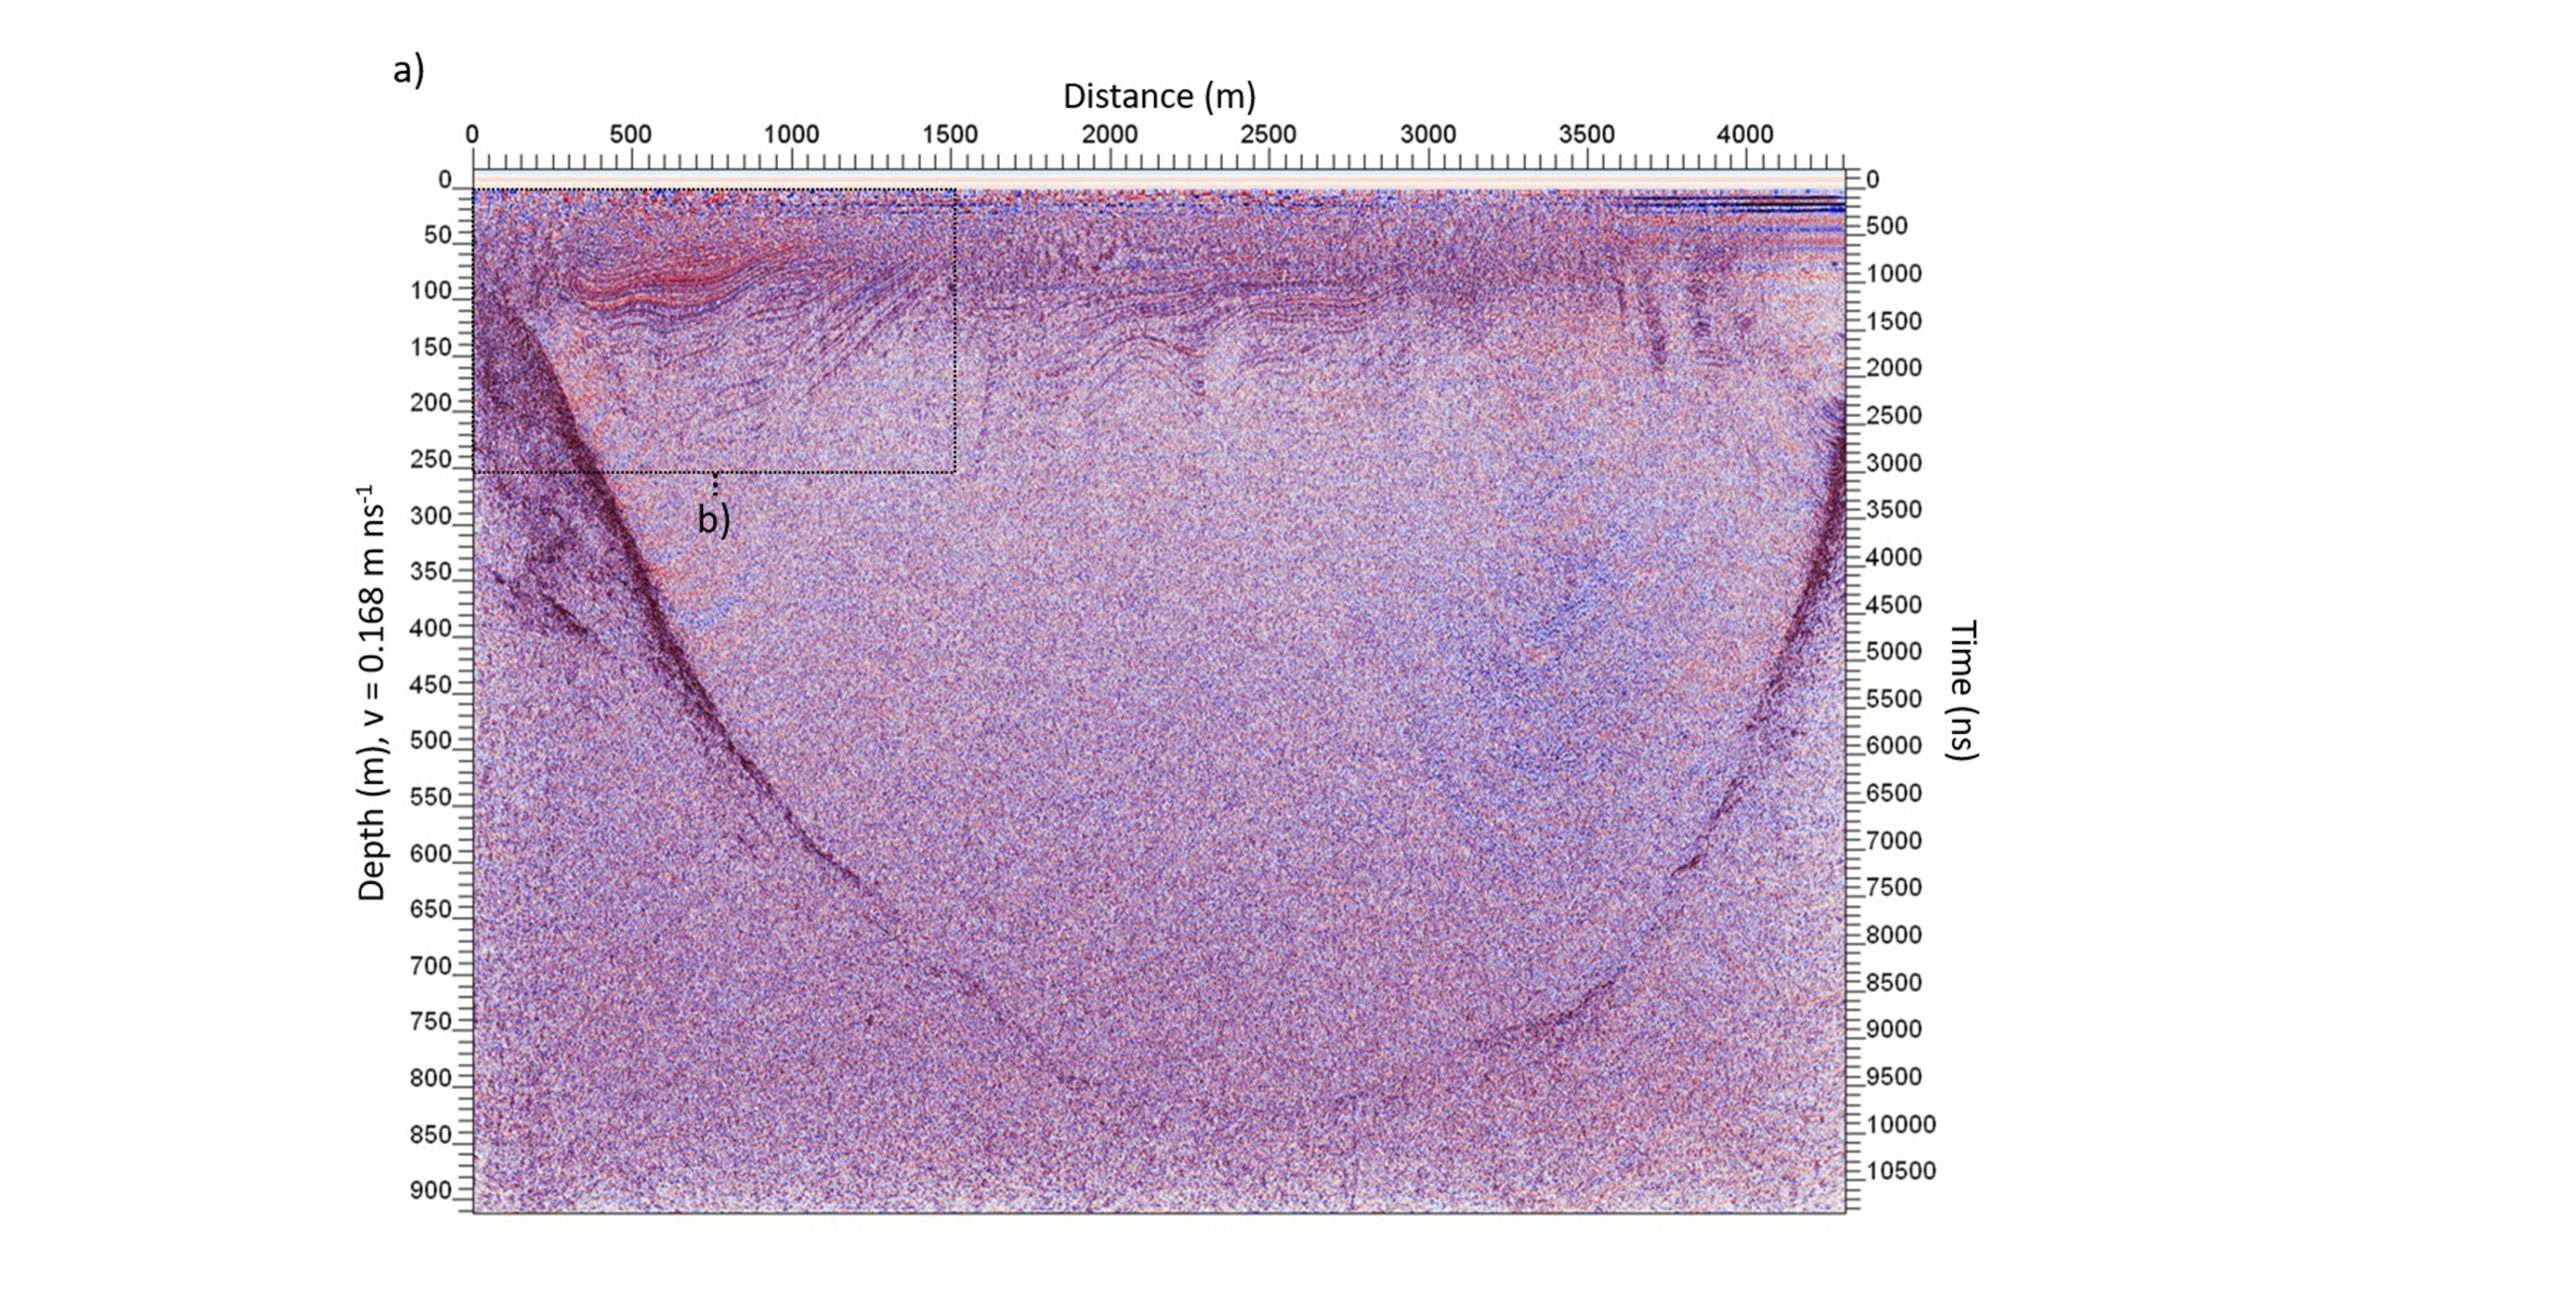
One of the first GPR profiles we collected during our 2008 Antarctic fieldwork is the 4500-meter-long line shown in Figure 3. The profile crosses the Touchdown Glacier and illustrates well the high degree of detail that can be achieved by a 25 MHz antenna setup. Strong shallow internal layer reflections in snow- and firn-covered glaciers predominantly relate to density differences caused by changing atmospheric conditions during precipitation events. Below a certain depth, firn compresses to form ice with a roughly constant density, and internal layer reflections are instead largely related to layers of volcanic dust originally deposited on the glacier surface. Along the Touchdown Glacier profile, the surface changes from snow-covered conditions to exposed blue ice at the very end of the profile. The profile consequently takes us from a region where annual snow settles and compresses to form firn and eventually ice, to a region where snow and ice is removed from the surface by strong katabatic winds. This change is observed clearly in the data where near-surface internal layers are absent or weaker, near the end of the profile (Figure 3a), while the general across-glacier decrease in annual snow accumulation results in the dipping of near-surface layers towards the start of the profile (Figure 3b). At depth, layer reflections are largely absent, and the ice appears reflection free. Multiple diffraction hyperbolas within the glacier at the very start of the profile (Figure 3b) can be explained by the presence of buried rockfall debris from nearby mountains.


While we did not observe this in the DVL display during data collection, the fully processed profile shows that the Touchdown Glacier is more than 850 m deep in the central parts of the radargram (Figure 3a). The apparent lack of basal reflections below 400 m of ice during data collection led to my most memorable interaction with any customer support, and I have had many! You rarely get a second chance at data collection in Antarctica, and we wanted to make sure the extensive rattling of the antennas while driving for long periods on blue ice was not affecting the data collection. I therefore contacted Sensors & Software via a poor satellite phone connection and set out to explain the situation to them. After initially being told to send the GPR to the nearest distributor for a check-up, I got in contact with an extremely resourceful technician. Following his advice, all antenna connections were successfully cleaned and improved using a toolset of whisky, cotton sticks, chocolate foil wrappings and silver duct tape!
Maybe it was because of these improvements that we managed to penetrate to an astonishing ice thickness of 1125 m on one of our last days in the field. This is the profile which is hanging on my office door, and it was collected travelling up glacier from where the ice flows into the floating Ross Ice Shelf (Figure 4). It is a fascinating profile which images the basal condition of grounding zones at an extraordinary level of detail. The dielectric contrast between ice and saltwater makes for a very strong basal reflection at the start of the profile, and the floating ice base is characterised by smooth nearhorizontal steps that increase in depth towards the grounding line. Near the grounding line, the increased abundance of diffraction hyperbolas illustrates the presence of basal crevasses as the ice flexes in response to tidal changes. The ice base reflection is eventually obscured by the hyperbolas only to reappear at the end of the profile as a weak reflection at about 1125 m below the glacier surface. At this location we believe the glacier is grounded and resting on bedrock.

Increased basal melting by relatively warm ocean waters and a downstream widening of the valley shape explains the dramatic 250 m ice thickness change which occurs in the region obscured by diffraction hyperbolas. Nearer the glacier surface the radargram is characterised by undulating internal layer reflections and large cone-shaped zones of high reflectivity extending from the glacier surface to an apparent depth of up to 400 m. These zones relate to reverberation of the GPR signal in shallow sub-surface water ponds that sometimes develop in blue ice areas. We had the misfortune of verifying this, as one of the snow scooters broke through the surface ice layer. It sounds more dramatic than it was, and as a geophysicist I highly appreciate the effort, although unintentional, to supplement GPR datasets with direct observations!
I have very fond memories of this field work in Antarctica as I now spend most of my time working on equally beautiful but “warm” Norwegian glaciers, where scattering of the GPR signal by internal water bodies significantly limits the level of detail and the GPR penetration depth. For example, on a recent fieldtrip to Jostedalsbreen Glacier, the 25 MHz GPR setup gave us a penetration depth generally well below 200 m. While GPR is still the preferred method for mapping warm glaciers, the data shown here clearly indicates that cold glaciers are really the ideal medium for GPR surveys.
For more information about the survey and the results, see the following publication:
Gillespie M.K., Lawson W., Rack W., Anderson B., Blankenship D.D., Young D.A. and Holt J.W. (2017), Geometry and ice dynamics of the Darwin–Hatherton glacial system, Transantarctic Mountains, Journal of Glaciology, 63, 959-972.
You can also contact the author on email: mette.kusk.gillespie@hvl.no


