urveying cemeteries is a common application for GPR due to its ability to detect non-metallic objects like coffins. It is also possible to find burials, even without coffins, by detecting the disturbed soil associated with digging the grave. But, for cemetery surveys (and many other types of surveys for that matter) keeping an open mind when interpreting GPR data is important because what you expect to see in the data, and what you really do see in the data, may not match.
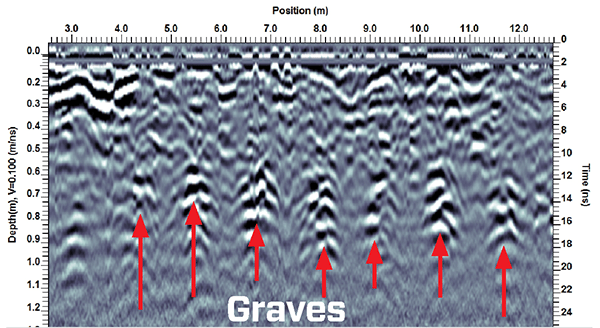
Noggin® 500 GPR data was collected over an area of unmarked graves in the Rebecca Street Cemetery in Pretoria, South Africa. Looking at one of the GPR cross-sections, a pattern of evenly-spaced hyperbolic responses at similar depths is observed (Figure 1).

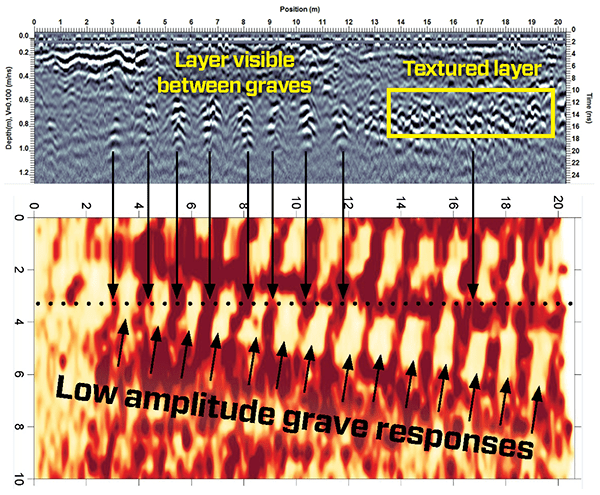
It is not an unreasonable interpretation to suggest that each hyperbola indicates the position of a grave. However, once a grid of data lines was collected and processed into depth slices, an interesting, unexpected pattern emerged that caused the operators to change their initial interpretation of the data. The 20 × 10 meter grid was collected in a few minutes by collecting 21 parallel lines, each 20 meters long and spaced 0.5 meters apart. Looking closely, the hyperbolic responses seen in the GPR line do NOT correspond with the grave responses in the depth slice. In fact, the hyperbolas are actually strong responses between the graves, while the graves in the depth slice are caused by weaker (low amplitude) GPR responses.
Figure 2 shows the GPR line at 3.5 meters that runs over top of several graves. Examining the cross section reveals that there is a strong scattering layer at about 0.7 meters depth. The GPR reflections from this layer, visible between the graves, were initially thought to be the responses from the graves.

This layer is characterized by a hyperbolic “texture”; many overlapping hyperbolas caused by the geometry of the layer (yellow box in Figure 2). This boundary could be very rough, with a jagged interface with the material above. Or, this layer may consist of coarse grained materials and large rocks, each one producing a hyperbolic response in the GPR cross-section. Both situations would account for the hyperbolic texture observed in the GPR line data.
The graves are located at the places where this layer is absent because it was removed when the graves were dug. In this case, the graves were not detected directly by the GPR but correspond to where the layer was NOT detected by the GPR. This layer was not exposed during the field work to ground truth the findings (for obvious reasons!) but we suspect that the grave diggers at this site are probably very familiar with this layer at 0.7 meters because it may be challenging to dig through. It is unfortunate that we were unable to confirm this notion.
This is an excellent example of the value of collecting GPR data in grids and generating depth slices to see the “big picture” before jumping to an interpretation of the data. It also shows how you need to be flexible with your thinking and be prepared to change your assumptions when faced with more evidence from the data – necessary skills to be an effective GPR interpreter.
Data courtesy of Dr. Jarrod Burks.
Click here to learn more about Noggin® Ground Penetrating Radar.


