


he GPR wave velocity provides direct and indirect benefits. First, knowing velocity is essential for the calculation of the depth of an object that appears in a GPR data section. Second, less commonly known, GPR velocity can be used to infer another physical property when an empirical relationship between velocity and the other physical property has been developed. For example, GPR velocity is often used to measure water content of materials; critical information for many industries such as agriculture and logging.
In principle, measuring the GPR velocity of a sample of material is relatively simple. First, ensure that the bottom of the sample is resting on a material with quite different electrical properties than the sample; a metal plate works well.
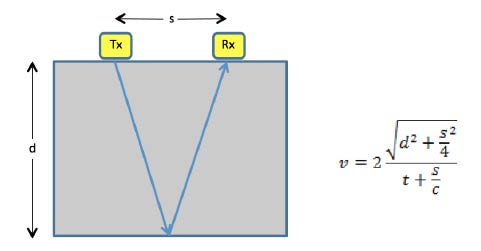
Second, good coupling between the GPR antennas and the sample is desired so creating a flat surface on the sample is optimal. With the GPR antennas in the middle of the sample collect a few GPR traces and average them to a single trace. Measure the arrival time (t) of the reflection event from the bottom of the sample. Using the known receiver/transmitter separation (s), and the speed of light in a vacuum (c) and the sample thickness (d) compute the velocity using equation in Figure 1.
There are a number of issues that need to be considered to get reliable results. Samples need to be sufficiently large to ensure that the measured travel time provides an accurate velocity and that there is no impact from the finite sample size on the measured travel time.
(Discussed in Redman et al 2016).
In general if the size of the face of the sample on which the GPR sits (diameter or width) is more than twice the antenna spacing, the impact on travel time is small. The amplitude of the reflected event is much more sensitive to sample size; the reflection from the bottom of the sample may be difficult to identify due to clutter or because it is of low amplitude. The following example illustrates a simple method to provide a more clearly identifiable reflection event.
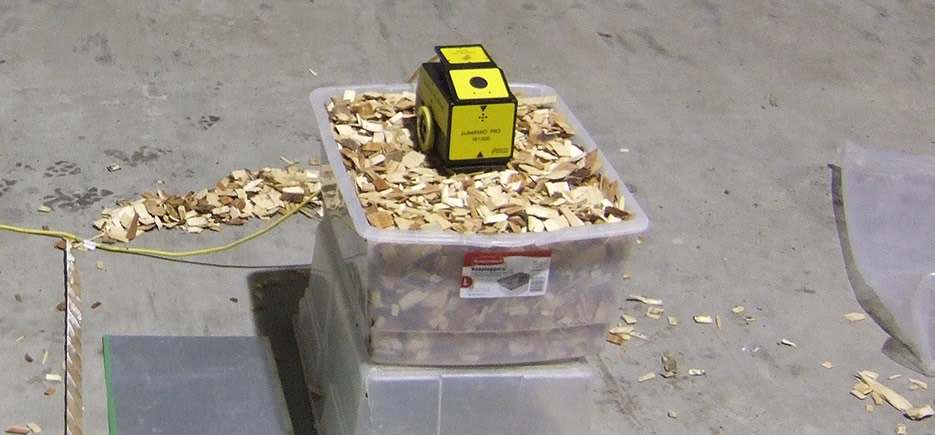
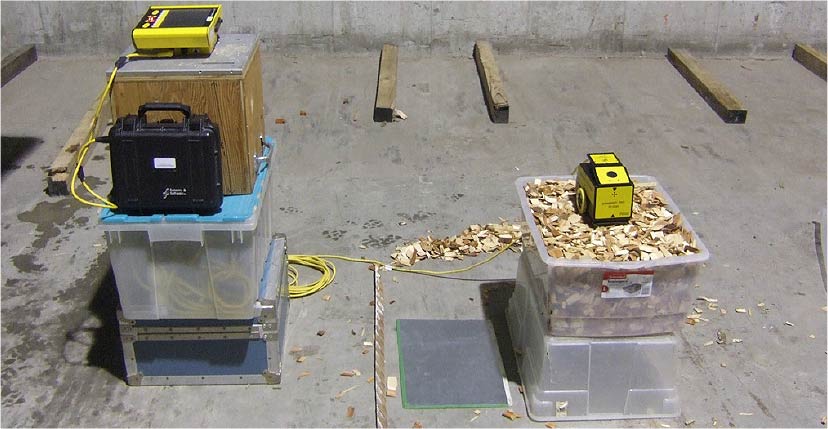
A pulseEKKO® PRO TR1000 GPR was used to acquire data on a sample of wood chips (Figure 2). Traces were acquired on the wood chips with a metal plate on the bottom of the container and then with the container directly on the plastic box (essentially air). The traces were averaged and a difference trace created.
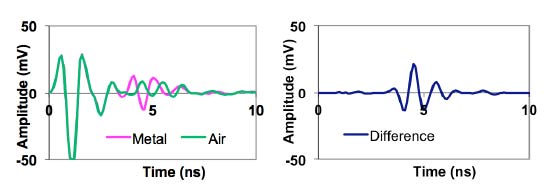
In Figure 3, the reflection events from the bottom of the sample can be seen in the left plot for both cases but determining the exact time of the bottom reflection is difficult. The difference between the two traces (Figure 3, right) shows a clearly identifiable reflection event. This approach dramatically improves the ability to see the desired reflection and provides better accuracy in determining the arrival time and consequently the measured velocity.
Measuring velocity in a sample enables estimation of a related property of the sample such as the water content. In this case, you need to measure velocity of samples where the water content is known from another reliable methodology (e.g. weighing sample wet and after drying).
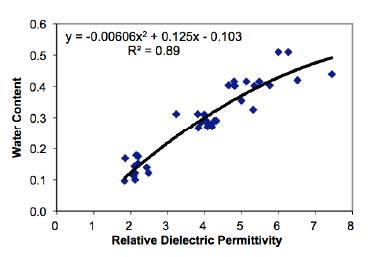
Then determine an empirical relationship between the GPR measured velocity and the known water content. Often, velocity is translated into relative dielectric permittivity, a more basic material property: Kr=(c/v)2 where c is the speed of light. Empirical relationships already exist for some materials such as soils, where the Topp relationship is commonly used to infer water content. An example of this methodology applied to wood chip samples with varying water content is shown in Figure 4.
In summary, GPR velocity can provide an indirect and fast measurement of physical properties of samples. This same methodology can be used to monitor changes in a physical property of a sample (such as water content) over time.


