


ensors & Software loves to share customer stories in our newsletter! The details and descriptions are those of the authors and Sensors & Software has not made any edits except for typographical errors. If you have a GPR topic of interest to share, please contact us and submit your suggestions.
Geoforensics is the application of geological/geophysical techniques to forensic and archaeological investigations. Accurate representations of the subsurface may be needed but cannot be acquired by invasive techniques that may disturb the ground in culturally sensitive areas, or areas involving a criminal investigation. Ground-penetrating radar (GPR) is a proven, non-destructive, and non-invasive geophysical technique used extensively for imaging the subsurface across a wide range of applications. Subsurface reconstructions using GPR have typically been presented as 2D vertical and horizontal cross sections, resulting in a visualization of subsurface objects and their spatial extents. With the development of new software, 3D modelling of GPR data is now emerging as the new standard. Despite these new developments, there remains an inadequate examination and testing of these techniques, especially in deciding if their application is justified and advantageous.
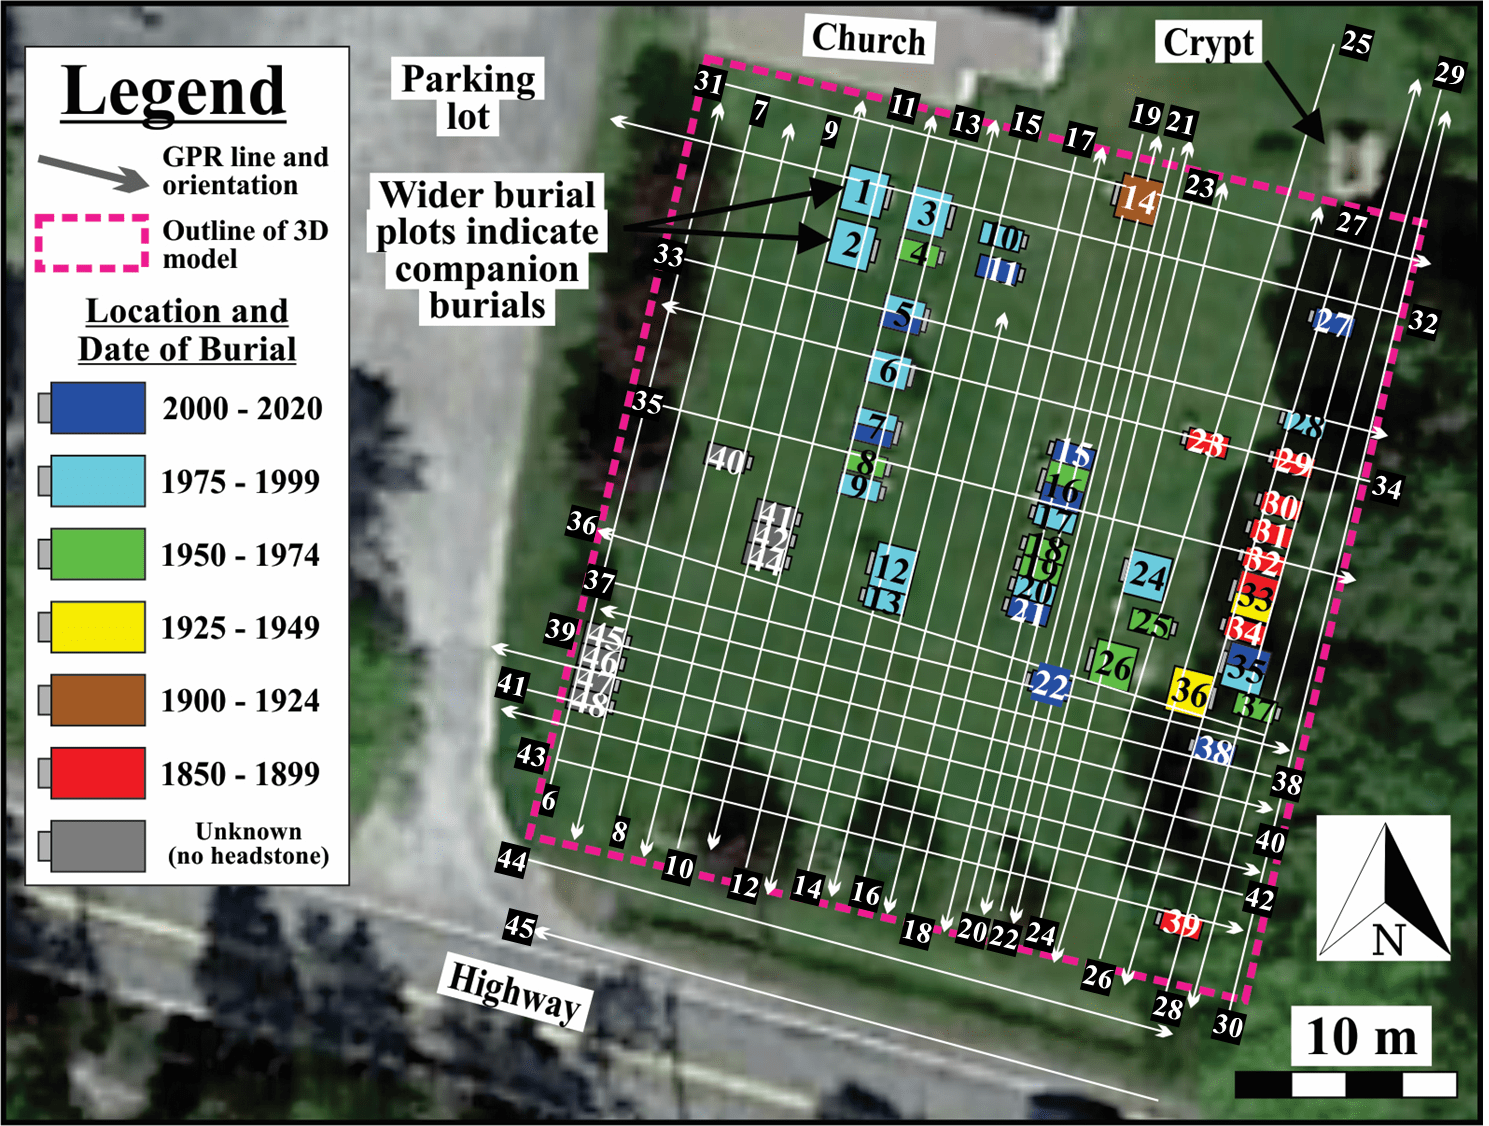
This study applied a GPR grid survey on a churchyard cemetery (Figure 2). to produce and assess 2D- and 3D-modelled reconstructions of the cemetery burial locations (Figures 3-5).
Two of the study objectives were to (1) demonstrate a unique workflow (Figure 1) method to visualize the data in 3D and (2) to provide a better understanding of the subsurface using a 3D model to accurately show the size and shape of buried objects and their spatial relationships.

Data collection and processing was achieved using a Sensors & Software pulseEKKO™ SmartCart GPR system and EKKO_Project™ software, respectively. The 3D modelling component was accomplished using Schlumberger’s Petrel™ E & P software platform, which is customized to the petroleum industry.
Study Area
The study area is a church cemetery located in Nova Scotia, Canada, approximately 44 km northwest of the capital of Halifax. The survey area consisted of the 30 by 40 meter (1,200 m2) southern section of the cemetery and resulted in a total of 40 separate radargrams (total distance of profiles was 1,352.5 m); 25 oriented north-south and 15 oriented east-west (Figure 2). Line spacing was approximately 1 m and was adjusted to avoid headstone locations and other surficial features. The 200 MHz center frequency antennae with a separation of 0.5 m were used for all lines.
Model Building and Results
The processed radargrams were exported from EKKO_Project™ into Petrel™ and interpolated to generate 40 2D depth slices of the subsurface, one every 0.1 m to a total depth of 4 m. The interpolation method in Petrel™ involved importing the 2D depth slices and interpolating data to create a solid 3D volume. This is common for displaying and understanding the 3D shape and spatial relationship of buried objects. In GPR literature, 3D models are displayed in one or a combination of four different ways (Figure 3).

A combination of Figure 3b and d provided the best render of the 3D model. Using a transparency filter to remove the low amplitude reflection signal component, the high amplitude reflections remain, which are displayed as the 3D blocks. The high amplitude reds and yellows suggest buried objects and show the shape and size accurately. Combining both the 2D radargrams and the 3D model, it is possible to reach an intuitive understanding of the subsurface.

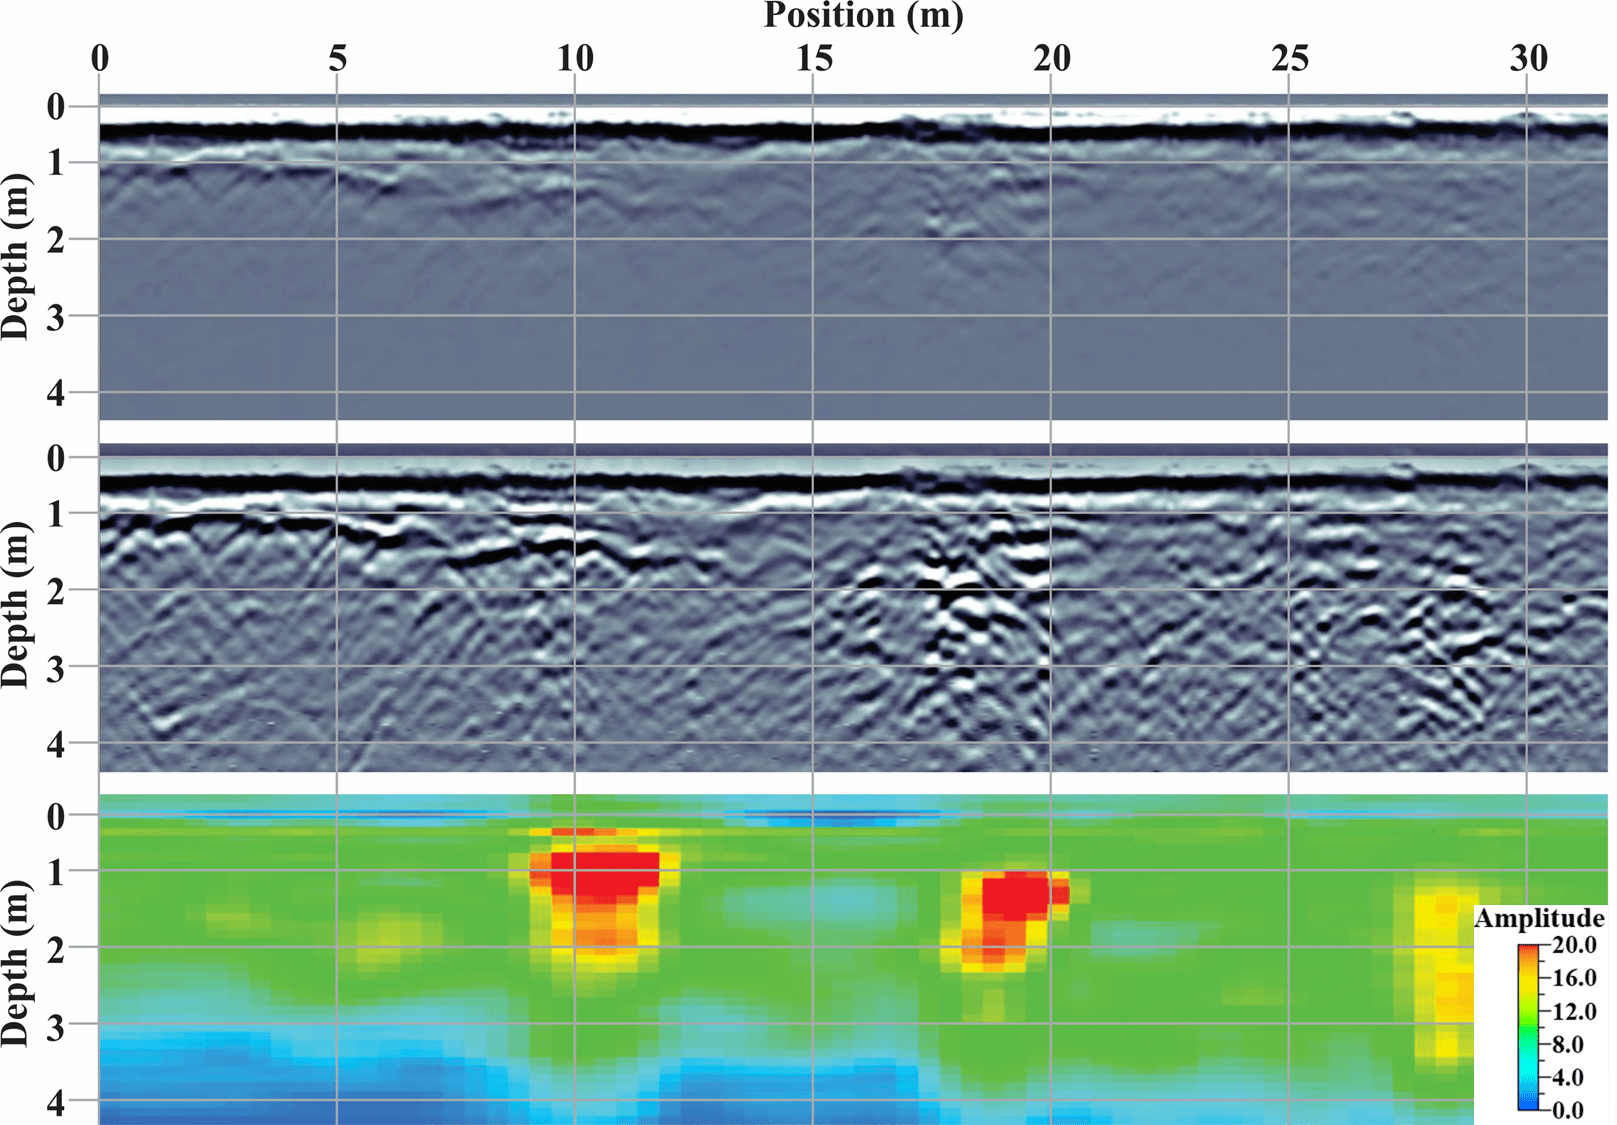
For example, GPR Line 35 crosses burials 8, 16, 17, and 32 (Figure 2). Figure 5 shows the radargram for Line 35: unprocessed (top), gained (middle) and the cross-section that is part of the 3D model (bottom). The unprocessed radargram indicates faint hyperbolic reflectors that dissipate below 3 m. The gained radargram reveals more clearer and abundant hyperbolic reflectors and suggests three regions of interest: (1) at 10 m, (2) at 17 – 20 m, and (3) at 28 – 30 m along the radargram. A cross-section through the 3D model shows the three zones more intensely. The high amplitude area at position 9 – 12 m corresponds to burial 8. The high amplitude area from 17 – 21 m corresponds to burials 16 and 17. The moderate amplitude zone between 27 – 30 m corresponds with burial 32.
Conclusions
The results of this study demonstrated the ability to (1) accurately map a cemetery, distinguishing burial sites from one another, (2) identify otherwise unknown burial sites and (3) create an overall more intuitive, easily manipulatable, 3D model to optimize visualization, a key requirement to help with GPR data interpretation. We expect our findings to be of value to geoforensic and archaeological studies, and criminal investigations.


