Utility Mapping
close X
Nav Menu
 

Utility Mapping

Create Stunning Maps and Reports

GPR data is saved and available for post-survey analysis and reporting, providing accurate records for future reference and comprehensive deliverables for your customers

Georeferenced maps and data

Easily plot images of your data path, screen shots and interpretations in Google Earth. All information is exported seamlessly for viewing in Google Earth and other GIS platforms.
underground cable and wire
Georeferenced Maps & Data

Create Utility maps in Google Earth

Plotting interpretations on GIS or aerial images and connecting them to show the utility path is a powerful way to portray your locate results.
cable and pipe detector
Utilities on Google Earth

Quickly Produce Summary reports

Take your locates to the next level by providing reports of your findings. Reports can be generated instantly with the EKKO_Project software, included with your GPR system.
sewer line locator
Generate Reports

Visualize utilities from Line Scan data

Collect GPR survey lines over large, odd-shaped or difficult-to-survey areas, and then seamlessly turn them into depth slices in EKKO_Project. This example shows two different methods for mapping drainage tiles using varying patterns of line collection. In this case, Line Scan data positioning was done with GPS.
gas line locator
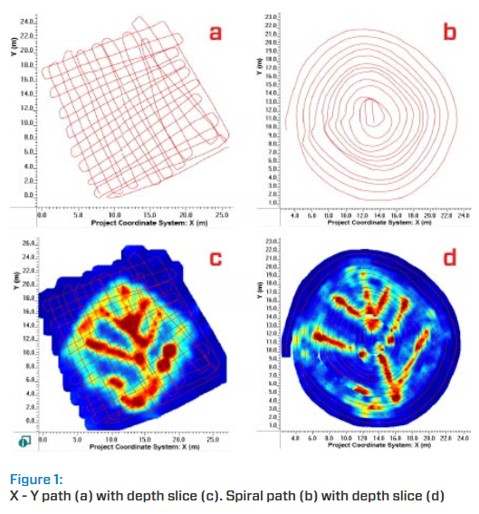
Mapping drainage tiles in Complex Areas

Visualize linear targets over large areas

Map utilities over large areas by collecting GPR lines and then processing them using SliceView in EKKO_Project. Linear utilities can be seen when line data is converted into depth slices, providing another way to visualize underground utilities without the need to set up a grid.
underground pipe locator rental
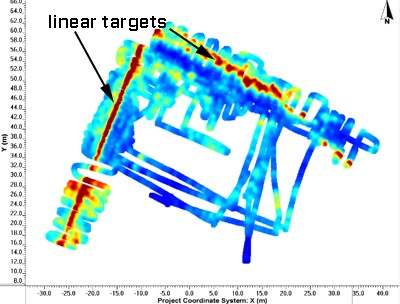
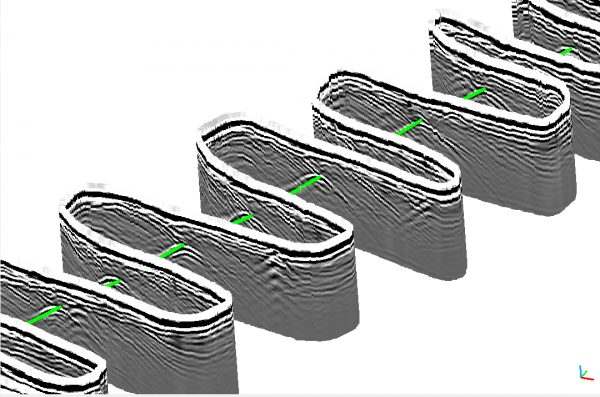
Series of GPR Line Scans & Depth Slices

3D Visualization

Depth slices can be viewed or made into 3D views to clearly show buried utilities.
underground utility mapping
3D Visualization

Point Cloud Visualization

Survey large areas with GPR integrated with GPS and then seamlessly turn them into a 3D Point Cloud file in EKKO_Project. This example shows hyperbolic responses from a linear utility crossed several times while collecting GPR data on a road.
underground utility locating equipment
Point Cloud Visualization

LinkedInFacebookTwitterEmail

Request More Information