Noggin: Adaptable, high-performance
ground penetrating radar
Noggin: Adaptable, high-performance ground penetrating radar
Noggin: Adaptable, high-performance
ground penetrating radar
Quickly survey & analyse pavement structure with Noggin GPR
In this example, 500m of road was surveyed in only 15 minutes using the Noggin 1000 SmartChariot GPR system and a report detailing the asphalt and granular boundaries was quickly generated using EKKO_Project.
Pavement evaluations usually involve expensive, labor-intensive, and destructive coring of the road structure to obtain estimates of the asphalt and granular thicknesses. Typically, cores are collected at set intervals to cover the length of the road with the spacing usually much greater than the scale of structure variations.
A GPR survey conducted before coring provides a solid basis for determining how many cores are really necessary and where they should be placed. For example, if the GPR survey shows that asphalt and granular boundaries show very little spatial variation, only one core may be required to validate the GPR interpretation. If the GPR survey reveals large variations in the subsurface, cores can be placed at positions of thick, thin or anomalous layering to understand the subsurface in detail.
In this case study, two parallel lines of GPR data were acquired on a 500 meter section of road using a Noggin 1000 on a vehicle-towed SmartChariot configuration. The odometer triggered data acquisition at 5 centimeter (2 inch) intervals for a total of about 20,000 unique sample points on the road. Data were acquired in about 15 minutes.
A cross-section of 100 meters of road data are shown in Figure A. The data indicate two main sub-horizontal boundaries inferred to be the bottom of asphalt/top of granular interface and the bottom of granular/sub-base material interface. These interpretations were confirmed by a core acquired near the 250m position on the GPR line (the coring location was not on the GPR line which explains the slight differences between the GPR and core layer thicknesses).
Using the EKKO_Project Interpretation module, the asphalt and granular bottoms were picked using the ‘polyline’ interpretation tool. Figure A depicts the asphalt bottom as blue and the granular bottom as green.

Figure A: Cross-section of road data showing the bottom of asphalt reflection in blue and the bottom of granular in green. The position and results of a core collected near the GPR line are also displayed, showing good correlation.
The EKKO_Project Pavement Structure Report module was used to translate the interpreted boundaries into a depth section and provide sampled output at a user-defined interval; the resulting section plot is shown in Figure B

Figure B: Pavement structure chart displaying the thicknesses of the asphalt and granular layers over a 470 meter length of road. Blank areas indicate areas where confident picks could not be made.
The layered structure reporting tool also provides output statistics including the minimum, maximum and average layer thicknesses such as shown in Figure C.

Figure C : Example of tabulated summary of analyzed GPR data.
The Pavement Structure Report module outputs the pavement thickness charts in a report format with several fields for the GPR operator to fill in including the road name, number of lanes and the GPR system used (depicted in Figure D). The report can then be printed or saved to a PDF document.

Figure D: Example of an automated report created from EKKO_Project that is easy to share as a pdf document.
See below the surface with the Noggin
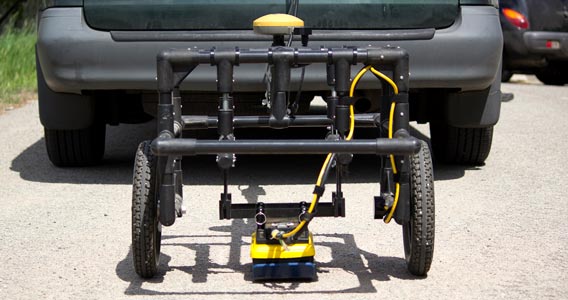
The product featured in this case study is the Noggin 1000 deployed in the SmartChariot configuration.

SmartChariot
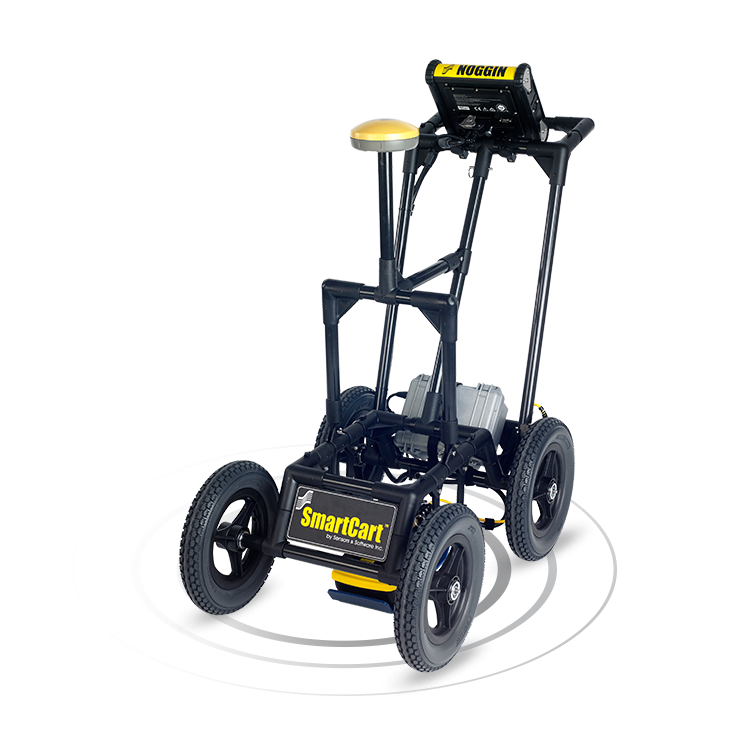
SmartCart
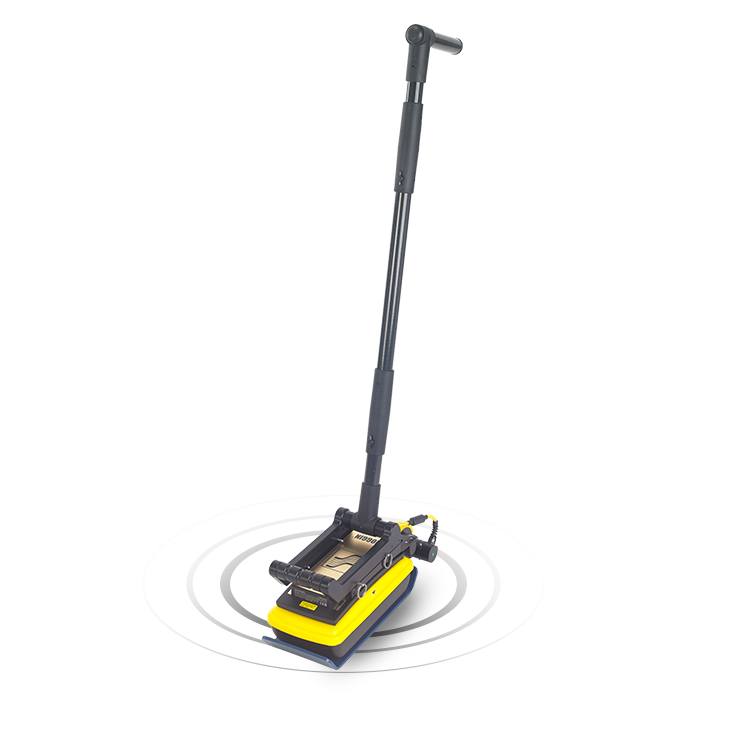
SmartHandle
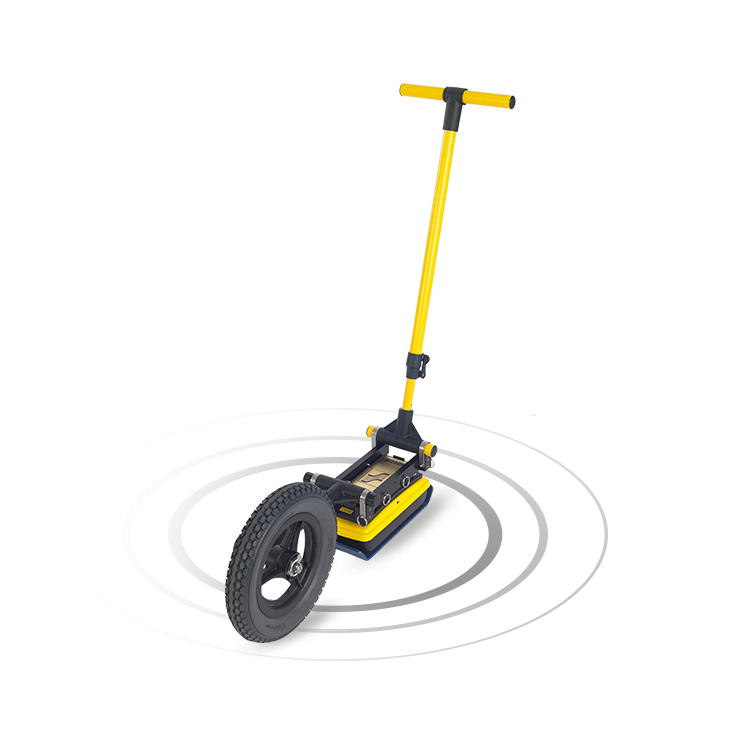
SmartTow
* Additional sensors & configurations are also available.


Get in touch with us
See how you can expand your service offerings with Noggin GPR.
Our solutions empower informed decision-making.
Sensors & Software delivers subsurface imaging solutions to customers worldwide. Understanding what lies beneath the surface of materials like soil, rock, rubble, pavement, concrete, water, ice and snow opens endless possibilities.

