Noggin: Adaptable, high-performance
ground penetrating radar
Noggin: Adaptable, high-performance ground penetrating radar
Noggin: Adaptable, high-performance
ground penetrating radar

Bridge Deck Condition Assessment
Noggin 1000 SmartChariot survey for Bridge Deck condition reporting
The degree of corrosion of metal reinforcing is a major concern with bridge decksand similar concrete structures. Since the presence of saline water and corrosion by-products causes strong attenuation of GPR signals, measuring and mapping the variations in GPR signal attenuation has become an accepted practice to assess the condition of concrete structures.
For this case study, GPR data were acquired on the 6 lanes of a 90 meter long bridge using a Noggin 1000 GPR in a SmartChariot vehicle-towed configuration. Three lines were collected in each lane: in the left wheel path , right wheel path and the center of the lane. This provided 18 lines with a total of approximately 1620 meters of GPR data on the bridge. A multi-ball hitch system on the tow vehicle allowed the SmartChariot to be towed in the center of the lane or the left or right wheel paths; this meant the tow vehicle was always driving safely in the center of the lane.

A multi-ball hitch system makes data acquisition in any part of the lane safe
Data collection took less than 1 hour. The SmartChariot odometer triggered data acquisition every 3 centimeters (about 1.25 inch) for a total of about 54,000 unique sample points on the bridge deck. A GPS was connected to the GPR system, enabling all data to be accurately geo-referenced. The positions of the survey lines are displayed in the Google Earth image. Data collection took less than 1 hour. In fact, more time was spent driving to the next exit and turning the tow vehicle around to collect another pass of the data than was spent actually acquiring the data.
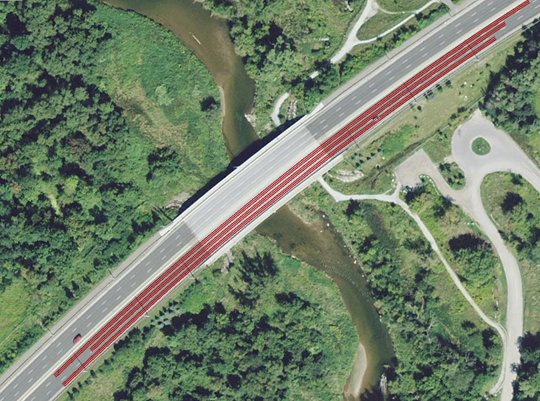
Bridge Survey Lines
After the data collection, the data were transferred from the data logger to a PC and the EKKO_Project software was used to process the bridge deck data. Specifically, the Interpretation module was used to pick the rebar responses; a total of 5480 interpretations. The data show that the rebar spacing on the bridge deck is 25 centimeters (approximately 10 inches). Using the EKKO_Project Interpretation module, the hyperbolic responses from the rebar were picked – the Smart Point feature was used to pick the best position of each rebar (blue dots).

A cross-section of a portion of one GPR line across the bridge is shown above.
The Bridge Deck Condition Report Module: The Bridge Deck Condition Report module processed the picked rebar amplitude values and created signal attenuation map images. The Bridge Deck Condition report software generates two types of response amplitude outputs:
1) raw amplitude GPR signal strength in millivolts (mV)
2) a normalized display presented in decibels (dB)
The latter map is often referred to as a Deterioration Index map and uses an enhanced version of the processing outlined in ASTM standard 6087 for GPR data on asphalt-covered bridge decks. In the map below, red areas have low amplitude indicating possible corrosion from salt infiltration.
Rebar Amplitude Map
The picked rebar data also provided useful statistics for the bridge engineers, including the minimum, maximum and average amplitude, rebar depth and rebar spacing.
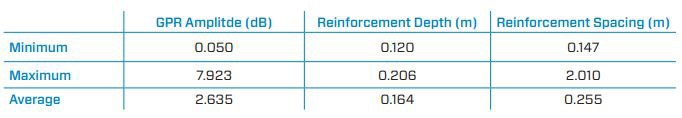
Rebar Data Report
All the information was presented as a Bridge Deck Condition Report in PDF format.

Bridge Deck Condition Report
See below the surface with the Noggin
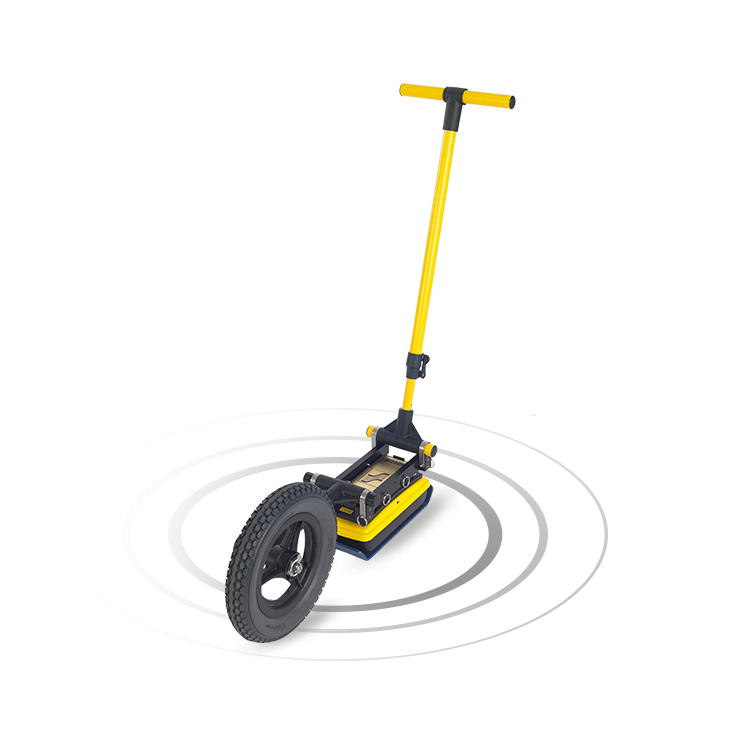
The product featured in this case study is the Noggin 1000 deployed in the SmartChariot configuration.

SmartChariot
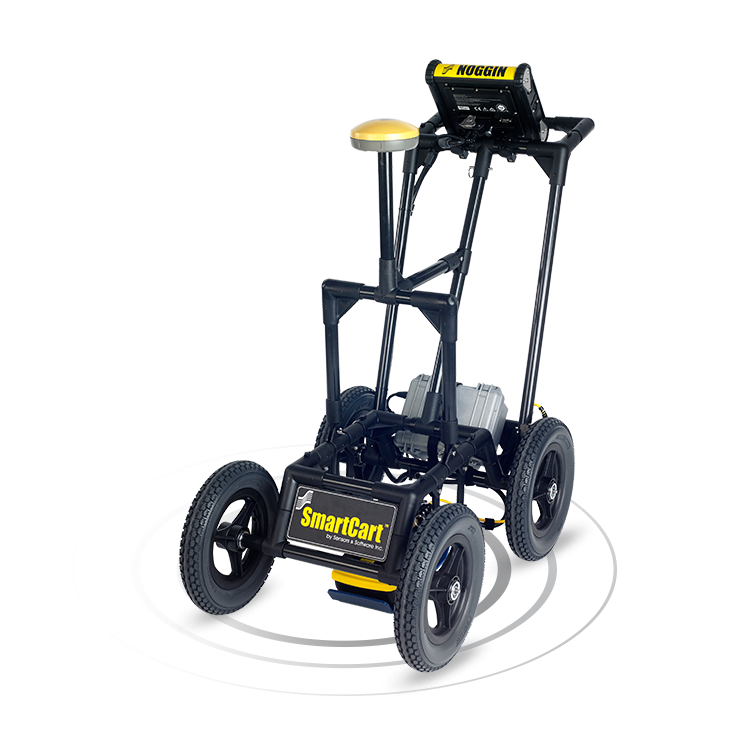
SmartCart
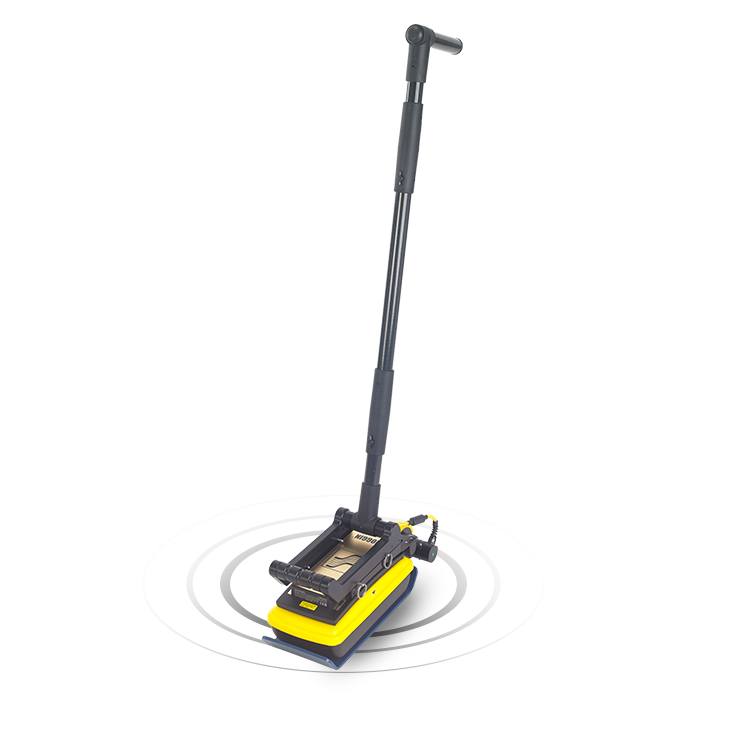
SmartHandle
SmartTow
* Additional sensors & configurations are also available.


Get in touch with us
See how you can expand your service offerings with Noggin GPR.
Our solutions empower informed decision-making.
Sensors & Software delivers subsurface imaging solutions to customers worldwide. Understanding what lies beneath the surface of materials like soil, rock, rubble, pavement, concrete, water, ice and snow opens endless possibilities. The combination of our diverse expertise, years of experience, world-leading products and responsive services enables delivery of practical and effective solutions that meet the needs of our customers. In a deeply specialized scientific and technical field, the focus is always to make complex challenges faced by our customers simpler and easier to tackle by using the most advanced instrumentation and integrated software.

