

LMX100 Manual online
1. Overview
This manual references LMX100™ embedded software version V1 R6. To see which software version is installed on your system, see the Swipe Down menu in Section See Section 3.4
The LMX100 Ground Penetrating Radar (GPR) system is optimized for locating buried utilities. With a very simple menu and user-friendly interface, you will be finding targets in minutes.
Features of the LMX100 include:
This manual describes everything you need to assemble the system, change settings and start scanning. There is also a section that describes the basics of GPR theory and techniques for locating utilities.
Online training videos for the LMX100 can be found on Sensors & Software’s website at this link:
https://www.sensoft.ca/training-events/training/lmx100-training-videos
2. Assembly
2.1 Out of the box
You will find the following components in your LMX100™ box. Some of these may already be assembled.

Attach the Cart Handle to Cart Base using the Handle Pins. Ensure the Display Unit Tray is facing the operator.

Attach the GPR Sensor to the Cart using the Sensor Support Straps. Ensure the Sensor is oriented the correct way with the connections toward the back of the Cart. Using the Sensor Support Straps, adjust the height of the Sensor so it is 1-2 cm (½ – ¾ inch) above the ground. The best way to get a uniform Sensor height is to place a couple of sheets of thick cardboard, particle board, or Styrofoam under the sensor before securing the Sensor Support Straps.

Attach the Display Unit onto the Display Unit Tray on the Cart. The Display unit slides down into the tray, catching on both sides of the mount and is held in place with the pull pin. When a click is heard, the Display Unit is firmly in place. Adjust the angle of the Display Unit by loosening the hand-screws underneath the Display Unit Tray, rotating the Display Unit to the desired angle and tightening the hand-screws. To remove the Display Unit, disconnect all cables, pull out the pull pin and lift the Display Unit up.

Attach the Display Cable to the back of the Display Unit with the jackscrews. Connect the other end of the cable to the Sensor. Ensure the cable is routed as shown below.

Attach the Odometer and Battery Cables. The Odometer Cable connects to the closest receptacle on the Sensor. Attach the Battery Cable to the Sensor and the Battery. The system is now setup and ready to use.

2.2 Fully Assembled
The fully assembled LMX100 will look like the following. Simply reverse directions to disassemble for transport.

3. Getting Started
3.1 Powering Up
When the battery is first plugged in, the LED goes green for 5 seconds then disappears.
To start the system, press the red power button on the display unit. The LED on the front panel will light up red.

Figure 3-1 Display Unit
Once boot up is complete, the colour of the LED will indicate the amount of battery power remaining:
- •100% to 20% = green
- •20% to 10% = orange
- •10% to 0% = red
The first time you turn on the LMX100, you will need to configure the system (Figure 3-1). A series of screen prompts will allow you to setup the language, units, date & time, and some other options. You will have to do this again anytime you update the embedded software (See Section 10.6).
Every subsequent time the system boots up, you will see the main screen (Figure 3-2).

Figure 3-2 Main Screen for LMX100
3.2 Shutting Down
To power down, press the red power button on the display unit once. A confirmation message will appear, after which you can press Yes to proceed. In the rare event that the display unit is unresponsive, a hard shutdown can be done by pressing and holding the red power button until the unit shuts down.
3.3 Interacting with the Display Unit
Data collection is controlled by the Display Unit. The Display Unit has embedded software to set survey parameters and collect, display and store data.
The Display Unit offers touch screen operation, as well as a water-resistant membrane keypad with a number of buttons that can be pressed to perform various tasks. Most operations can be done using either the touch screen or the keypad.
Use the following table as a guide to working with the keypad on the Display Unit:

3.4 Swipe Down Menu

Figure 3-3 Swipe-Down menu
When the Display Unit is powered on, you can “swipe” your finger from the top of the screen towards the bottom, to display a Swipe-Down menu (Figure 3-3) with the following items:
Date and Time: The current date and time (12-hour clock). The time needs to be changed in areas that observe daylight-savings-time.
Battery: The battery icon displays the amount of power remaining in the battery.
GPS:Shows the status of the GPS receiver.
Wi-Fi Network: Indicates if the system is connected to a wireless network and, if so, the name of the network. See Section 4.1.6 for details on connecting the system to a wireless network.
Volume: The Volume + and – buttons are used to increase and decrease speaker volume.
Brightness: The Brightness + and – buttons are used to increase and decrease the screen brightness. Increasing the brightness setting may improve the visibility of the screen in bright sunlight. Note, however, that increasing the screen brightness also increases power consumption, thus reducing battery life.
To close the Swipe-Down menu, touch anywhere on the screen below the swipe-down menu.
4. Tools
From the main screen shown, press Tools to enter this sub-menu. Here you can set preferences, adjust system settings, perform system tests and manage files. You will see the screen shown in Figure 4-1:

Figure 4-1 Tools Menu
4.1 Preferences
Selecting the preferences option will take you to the sub-menu shown in Figure 4-2.

Figure 4-2 Setting Preferences
There are several parameters that can be modified. Touch the screen and swipe up or down to scroll and view additional parameters. To change a value, press the value on the right side of the screen. Alternatively, use the up and down arrows on the 4-way keypad to highlight the desired parameter, then press Edit. Each parameter is described in detail below.
4.1.1 Language / Locale
Selecting this option will display the screen in Figure 4-3. The current language is displayed; pressing the + and – buttons on either side of the language will cycle between the languages currently available. Below that, the Country/Region is displayed. Press the + and – buttons on either side of the displayed Country/Region to alphabetically move to the next or previous country or region.
Alternatively, both Language and Country/Region can be changed by pressing the + and – buttons on the bottom of the screen. Press Back when you are done.

Figure 4-3 Changing Language and Country/Region
4.1.2 Units
Pressing Units will cycle between US Standard and Metric Units.
4.1.3 Date/Time
Selecting this option takes you to a screen where the date and time can be set. The time is manually set and will not automatically correct for daylight savings time.
4.1.4 Volume
Scroll bar for adjusting the volume of clicks and beeps heard during operation. This can also be changed by using the Swipe Down menu ( Section 3.4) anytime the system is not collecting data.
4.1.5 Brightness
Scroll bar for adjusting the brightness of the screen. Note that increasing the brightness consumes more battery power. This can also be changed by using the Swipe Down menu (Section 3.4. ) anytime the system is not collecting data.
4.1.6 Wi-Fi Network
Connecting to a wireless network allows you to send a mini-report to someone by e-mail.
This connection can be through a standard Wi-Fi network or through a hotspot on your mobile device while in the field.
Note that LMX100 CANNOT connect to Public Hotspots (typically restaurants, hotels and airports) that require a web-based login and acceptance of their Terms & Conditions. It also CANNOT connect to unsecured networks (networks that do not require a password).
If you are already connected to a Wi-Fi network, the name of the network is listed beside the Wi-Fi Network field. Selecting Wi-Fi Settings takes you to a sub-menu (Figure 4-4) for connecting and configuring Wi-Fi settings.

Figure 4-4 Configuring Wireless settings and E-mail address
Use the up and down arrows on the 4-way directional keypad or touchscreen to select the network. The color of the Network Name indicates the status:
o Connect – Select the desired network and press Connect.
If the connection is successful (this can take a minute or so) a screen appears asking for the password for that network. If the network name is yellow (from a previous connection to this network), it will not ask for a password because it is a remembered network. Once it connects the Network Name will turn green.
oForget – Use the Forget button to remove the password for connected or remembered networks (text in green or yellow). Once the ‘forget’ button is pressed on a selected network it will remove the password and the Network Name will turn white. You will also be disconnected if you are currently connected to that network.
oScan – Scans for any available networks in the area and displays them in order of strength of signal. You may need to press this button a second time if you don’t see the network you are looking for.
o Details – Pressing this button displays the security settings and device addresses related to the selected network.
o Back – Press this button to return to the System Settings screen.
4.1.7 Email
Press E-mail to arrive at a sub-menu where you can setup and configure a sending e-mail address. Ensure that this e-mail address already exists. This is the sending account where messages will originate from. All mini-reports received by the recipient will appear to come from this account.
Using GMAIL
Using a Gmail address on the Display Unit requires “app specific password”. An app specific password is a 16 character randomly generated passcode that allows access to a portion of the overall Google account. These passwords can be deleted at any time if the user feels it has been compromised. Note that 2 factor authentication is required for the use of app specific passwords.
The following procedure details the steps required to enable and generate an app specific password:
1) Log into Google account on a desktop computer.
2) Click on the top right account icon and select Manage your Google Account

3) Select Security from the left menu

4) Scroll down to the Signing into Google section and turn on 2-Step Verification (if it is not already enabled). Follow the onscreen instructions to add/verify your phone number

5) Return to the Security menu and you should now find the App passwords option under Signing into Google. Click on App passwords.

6) Under “Select app” choose Mail, and under “Select device” choose Other and enter an appropriate name (i.e., DVL). Click Generate.
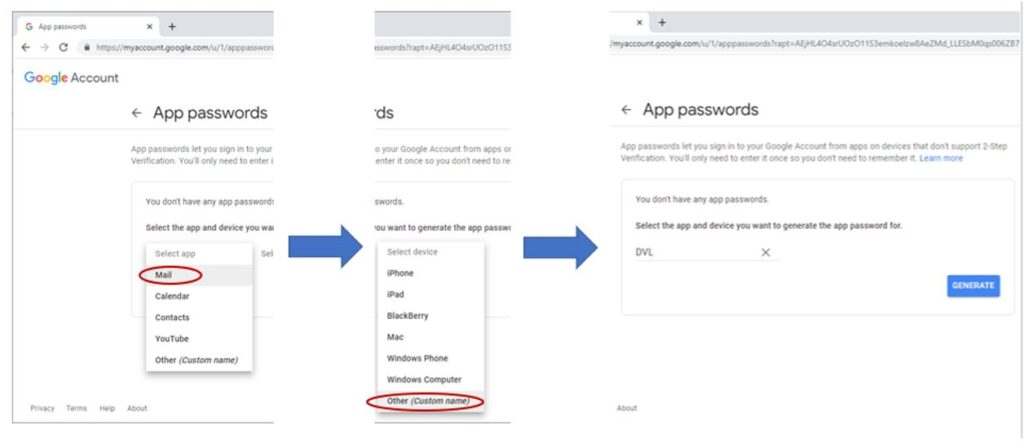
7) Use the generated 16-character password when configuring your Gmail account on the DVL:
Once you have made the changes in your Google account, continue below (Figure 4-5):

Figure 4-5 Using GMAIL as e-mail provider
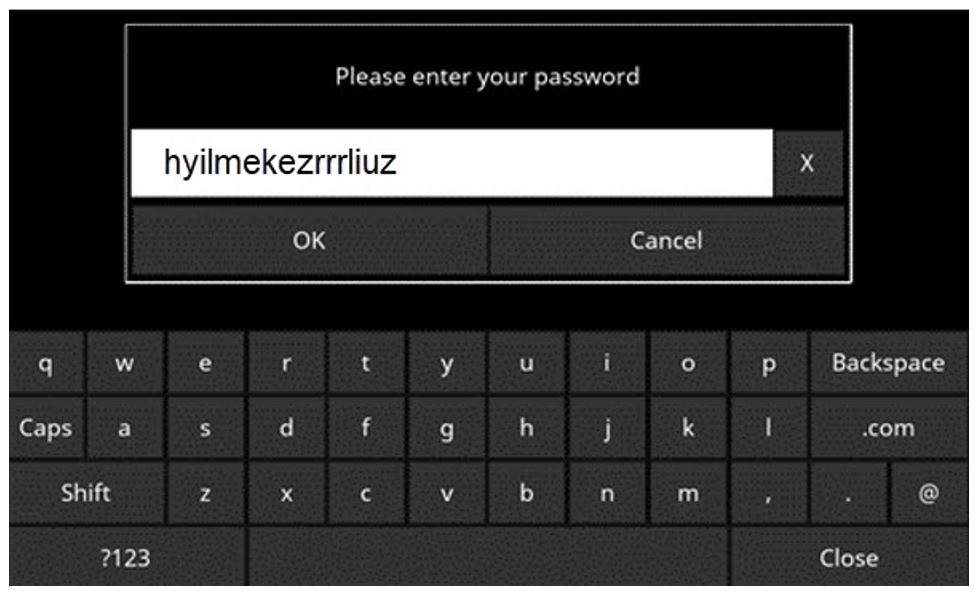
•Press Username to display a keyboard where you can enter your GMAIL username only; you do not need to enter @gmail.com. Then press OK when done (Figure 4-6a)
• Press Password to display a keyboard where you can enter your GMAIL password. Then press OK when done (Figure 4-6b)
• Press Save when both Username and Password have been entered.

Figure 4-6 Entering e-mail address (a) and password (b) for GMAIL
If there are no warning messages, the e-mail address is setup properly and you are ready to e-mail mini-reports from the field. If this does not work, see the Failed Setup section below
Using Another Provider
To use another e-mail provider, press the + and – buttons under Provider until it says Custom. This will display the screen shown in Figure 4-7 allowing you to setup and configure a different e-mail provider:
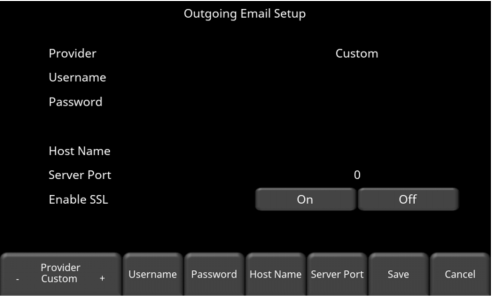
Figure 4-7 Entering e-mail address and password for another e-mail provider
• Press Username to display a keyboard where you can enter the complete e-mail address, then press OK when done.
• Press Password to display a keyboard where you can enter the password, then press OK when done.
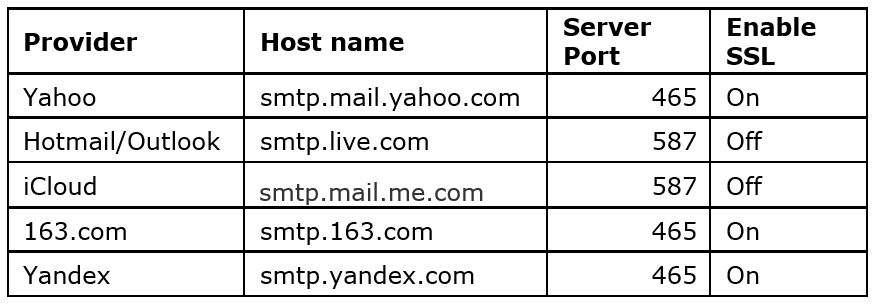
• Press Host Name to display a keyboard where you can enter the name of the server address handling the outgoing mail. See chart below for some common email providers. If your provider is not listed, it can usually be found by searching online for “SMTP host name provider”, where provider is the host name e.g., Yahoo or AOL. Press OK when done.
• Press Server Port to display a keyboard where you can enter the port number used by the email server. Searching online for host name will usually provide the port number for that e-mail provider. In most cases, it’s usually 465 (if SSL is enabled, see next bullet point), or 587. See chart below for some examples. Press OK when done.
• Enable SSL – you can select On or Off on the display. SSL provides encryption security. Some e-mail providers require this set to ON. This will usually be indicated on the same online search page that was used above. See the chart below for examples.
• Press Save when all the information is entered and correct.
Below is the chart for some common e-mail providers:
If there are no warning messages, the e-mail address is setup properly and you are ready to e-mail mini-reports from the field.
Failed Setup
If setup failed, possible reasons include:
1. No-Wi-Fi connectivity
2. Email address or password was entered incorrectly – try re-entering these fields.
3. Hostname, port or SSL setting are incorrect
4. Your email security settings may need to be adjusted to a more permissive setting, which may require you to login to your email account from a PC or mobile device.
4.1.8 Screen Saver
A screen saver can be setup to turn off the Display Unit screen after a period of inactivity to save power. The Screen Saver can be set to turn the screen off after 1 minute, 5 minutes or never (OFF setting). Pressing this button cycles between those three options. When the screensaver is activated and the screen shuts off, touch anywhere on the screen to turn it back on again.
4.1.9 GPR Plot Options
Selecting this option will display the screen in Figure 4-8.
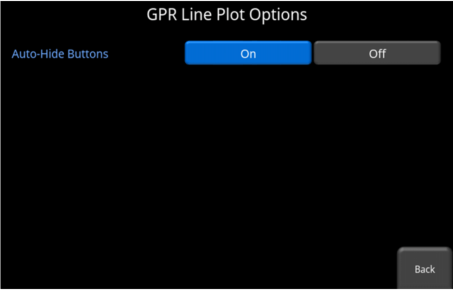
Figure 4-8 GPR Line Plot Options
Auto-Hide Buttons – If this is set to ON, then in Line Scan mode, the buttons at the bottom of the screen disappear shortly after data collection begins, effectively enlarging the area for data display. The buttons will re-appear after a couple of seconds whenever the sensor stops moving forward, is in back-up mode or any button is pressed on the keypad.
4.1.10 Reset to Defaults
Selecting this option at the bottom of the screen will reset all settings & preferences back to the default settings (Figure 4-9). Pressing this will ask you to confirm the Reset to Defaults. If Yes is selected, the next screen will ask if you would like to remove all saved wireless networks and e-mails addresses. Note that any saved screenshots will still remain on the system.
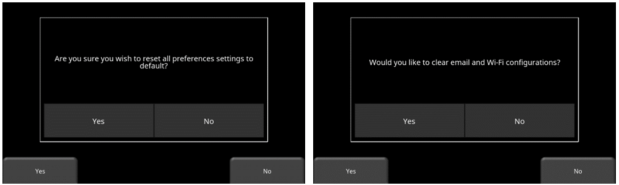
Figure 4-9 Reset to Defaults, a) Image on left is the first confirmation screen. b) If you press Yes, you will see the second confirmation screen on the right asking about deleting e-mails and Wi-Fi settings.
4.2 System Test
The System Test sub-menu (Figure 4-10) allows the user to perform certain tests to ensure proper operation of the system. Select the component to test then press Start. After completing a test there is an indication of whether the system passed or failed the test. Each test is described below in more detail.

Figure 4-10: System Test menu
4.2.1 System Information
System Information is the only option in System Test which is not actually a test. Here information such as the version, serial numbers, temperature and battery power are displayed. (Figure 4-11). There are two options at the bottom of this screen:
• Export – If a USB key is currently inserted, pressing Export will just export the System Log and Summary Files

Figure 4-11 System Information
• Anonymous Usage Statistics – When this is set to ON and the user is connected to a wireless network, any system malfunctions will trigger an automatic notification to Sensors & Software. This is to help with gathering information about any system irregularities. As the name suggests, the notification is completely anonymous and no personal information is sent.
4.2.2 Keypad Test
The keypad test ensures that all buttons on the membrane keypad are working. Press Start to begin the test which requires the user to press each button once, within a 20 second timeframe (Figure 4-12).

Figure 4-12 Keypad Test
Once that is complete, a short LED test will ensue, which checks the proper operation of the LED.
4.2.3 Audio
This test ensures that the speaking is operating properly (4-13). After starting the test, you should hear a sound with an increasing pitch.

Figure 4-13 Audio Test
4.2.4 Touch Screen
The test checks proper operation of the touch screen (Figure 4-14). It allows you to test the screen (by pressing Test) or perform a quick calibration followed by a test (by pressing Calibrate). Both involve touching targets on the screen in the allotted time.

Figure 4-14 Touch Screen test on the left, Touch Screen calibration test on the right
4.2.5 Sensor Test
This test checks proper operation of the GPR sensor, including the amplitude of the pulse. Once the cart is tipped backwards and start is pressed, it will conduct the test (Figure 4-15). If there are any irregularities, the test will indicate failure. However, if the test passes, it doesn’t mean the system is working perfectly. A test line should be setup as a baseline, and results compared to the test line to validate proper performance and operation ( Section 9.6)

Figure 4-15: Sensor Test
4.2.6 Odometer Calibration
This test ensures that the odometer is measuring distance accurately. Even though the odometer is calibrated in the factory, you must calibrate it periodically to ensure accuracy. This is particularly important as the calibration can change with different surface materials.
When selecting this option, you will see the screen in Figure 4-16. The following options exist:

Figure 4-16: Screen displaying current odometer calibration
• Odometer Test – This test verifies the odometer is calibrated properly. It involves moving the system a set distance (5m or 10’, depending on units used), and comparing the value obtained to a known value. The screen in Figure 4-17 will be displayed once Odometer Test is pressed. Press Start to begin and then press Finish when you’ve moved that distance. It will display a pass or fail, along with a percentage difference from the known value (Figure 4-18).
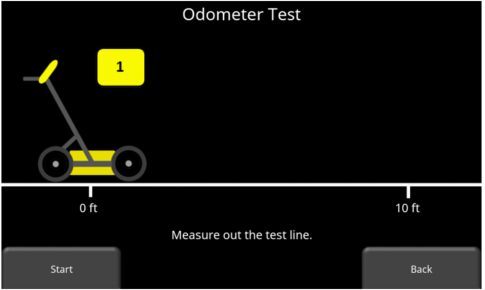
Figure 4-17 Doing an odometer test
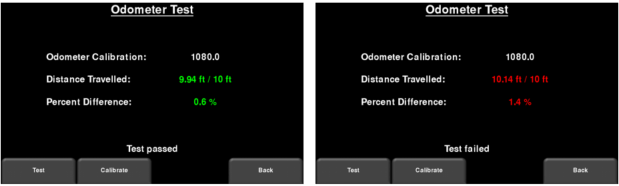
Figure 4-18 Odometer Test passed on left, failed on the right
• Odometer Calibration – This option actually calibrates the odometer (Figure 4-19). Choose a set distance from the screen or select Custom. Then press Start and move the system that exact distance, using a measuring tape or other known distance indicator. Press Finish when you have travelled that distance

Figure 4-19 Odometer Calibration – select a distance and then press Start
Upon completion, it displays the screen in Figure 4-20 (left image). You can either accept the new value by pressing Accept or revert back to the previous value by pressing Reject. If the new value is significantly out of range, the test will fail Figure 4-20 (right image).
The odometer calibration value is stored in the Display Unit. If the Display Unit is changed, or swapped out, you will need to run the Odometer Calibration test again.
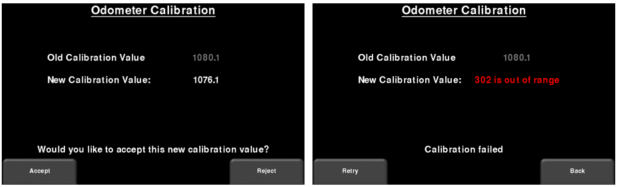
Figure 4-20 Results of successful Odometer Calibration (Left). Image on Right shows a failure, as calibration is out of range
4.2.7 GPS
The internal GPS can be used to geo-reference screenshots, so they can be positioned on Google EarthTM for example. The GPS test will ensure that the system is communicating properly with the GPS and receiving data (Figure 4-21). It doesn’t mean you are actually seeing satellites; the GPS test can still pass indoors with zero satellites visible.
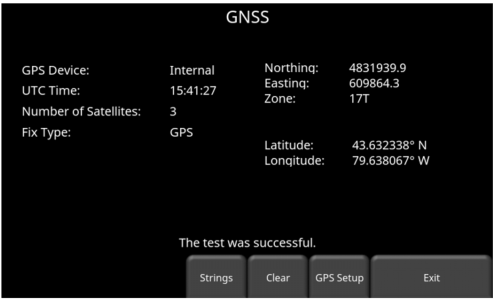
Figure 4-21: GPS Test
The basic position and time information is displayed on the screen. On the screen, the Fix Type notes if there are any corrections being applied, such as DGPS. When first going outside, give it a few minutes to track, or lock onto satellites.
Pressing Strings will display the raw data strings that are outputted by the GPS (Figure 4-22) as they scroll down the screen. The user may select this option to verify the GPS is outputting the proper NMEA string format.

Figure 4-22: GPS Strings
Pressing Clear will clear the strings. Pressing Info will return to the main GPS test menu.
5. GPR Concepts
5.1 Theory
Ground penetrating radar (GPR) technology uses radio waves to image objects in the subsurface. The subsurface may consist of soil, rock, asphalt and other materials. GPR systems emit high frequency radio wave pulses and detect the echoes that return from objects within the subsurface. Echoes are produced when the target material is different from the host material (e.g. PVC pipe in gravel)
5.2 Hyperbolas
The GPR display shows signal amplitude versus depth (time) and sensor position along a line. This is called a “Line Scan”. Since radar energy radiates in a 3D cone shape rather than a thin beam, a hyperbola (or inverted U) is the GPR response from a small point target like a pipe, rock, or a tree root. The radar wave hits the object before and after going over it and forms a hyperbolic reflection that can appear on the record even though the object is not directly below the radar:

Hyperbolas are best viewed when subsurface targets are crossed perpendicularly (at a 90-degree angle). The actual position of the object is located at the apex of the hyperbola.

5.3 Calculating Depth
Ground penetrating radar records the time it takes a radio wave to travel to a target and back; it does not measure the depth to that target directly. Depth to target is calculated based on the velocity with which the wave travels to the target and back.
To calculate depth:
- D=V x T/2
- Where D is Depth
- V is Velocity
- T is the Two-way travel time
For the LMX100, velocity is indicated by the Soil Calibration Value, known as Soil Cal. Once the Soil Cal values are set, the measured depths will be determined accurately (Section 6.2.4)
5.4 Soil Calibration values
Below is a table of common subsurface materials and their corresponding Soil Cal. This is only a guideline and there is some variation based on the fact that there can be a mixture of different materials in the subsurface. By far, the soil water content has the biggest influence on Soil Cal values.

5.5 Air Waves
Some hyperbolas are caused by air wave reflections from objects above ground, such as posts, fences, overhead wires, and trees.
The following image displays how air wave reflections affect data:

An important part of understanding the data image is learning to recognize these unwanted “air” targets and distinguish them from the targets in the ground. Good field notes are indispensable for helping identify unwanted events on the data.
The best way to identify air reflections is the target hyperbola method. Hyperbolas from above ground objects are wider than objects in the ground and will have a Soil Cal at, or close to, 300.
To learn more, see Soil Cal (Section 6.2.4).
6. Data Collection
GPR data is collected along a straight line, and allows the operator to view it as a cross-section image. The operator can locate a feature and easily back-up and mark the location of that object on the ground. The operator can identify the alignment of subsurface features, check for linearity and acquire accurate depth measurements. From the main screen, press the Start button; you will see the screen shown in Figure 6-1.

Figure 6-1 Data Collection screen
The GPS Status Indicator (lower left in Figure 6-1) shows the quality of the GPS signal, which is based on the number of satellites that it sees. The chart below explains what the colours and bars mean:

6.1 Acquiring Data
The system is ready to collect data as soon as you see this screen. As the system is pushed along a straight line, the collected GPR data scrolls onto the screen from the right and moves to the left (Figure 6-2).
The depth scale along the side of the GPR Line image and the position scale along the top of the image are set to Metric or US Standard units based on the setting in the Preferences menu.
If Auto-Hide Buttons is set to ON (Section 4.1.9), the menu at the bottom of the screen disappears as soon as you start collecting new data, thereby maximizing the data display area. When the user stops, backs up or presses a button on the keypad the menu reappears.

Figure 6-2 Data collection screen showing axis labels. DynaQ indicator is shown at the bottom above the menu options.
6.1.1 DynaQ®
DynaQ is an advanced patented technology that adjusts data quality as the system movement speed varies. In most situations, moving the system at a comfortable walking speed generates data of good quality. In situations where target resolution or maximum penetration depth is critical, moving slower increases data quality.
As the Line Scan data scrolls on the screen, the DynaQ Index Bar is displayed along the bottom of the screen (Figure 6-2). The color of the bar indicates the quality of the data at that point along the line:

In general, avoid collecting data at extremely high speeds.
6.1.2 Back-up Indicator
Data collection mode incorporates a back-up feature to enable you to accurately locate targets and mark them on the ground. After acquiring some data on the screen, pull the system backwards (Figure 6-3a).
During back-up mode, there will be two indicators:
• Position Indicator: The red vertical line corresponds to the location at the center of the GPR sensor. As you pull the cart backwards, the Position Indicator moves to mark the current location of the cart in the image and a box appears with the current position, relative to the start of the line, listed as the top number.
• Depth Indicator: A short red horizontal line corresponds to the current depth value, as shown in the lower number in the box at the bottom of the screen. To determine the depth of an object, move the indicator up or down by dragging the horizontal line to the desired location (Figure 6-3b). Alternatively, you can also use the Up and Down arrows on the 4-way directional keypad. Note: make sure you have done a Soil Calibration to ensure depth accuracy (Section 6.2.4).

Figure 6-3 a) Back-up Indicator, b) Moving the Depth Indicator to the top of the hyperbola
To locate a feature, simply roll the system back along the same path until the red vertical line is exactly over the response (usually a hyperbola). You can mark the location of the object on the surface and continue data collection. Once you reach the point where you initially started backing-up, the system will continue acquiring new data.
You can also obtain depth and position information anywhere on the Line Scan by touching the screen, holding for a second, then releasing. A cross-hair appears where you touched the screen, with a box displaying the position and depth (Figure 6-4). To get the position and depth information about a different point on the screen, simply touch and drag the box or cross-hair to the desired position.

Figure 6-4 Touch screen to get depth and horizontal position at any point
6.1.3 Pause
The Pause button allows you to temporarily stop data collection and resume again, without clearing the data from the screen. This might be useful if you want to collect a series of parallel lines over a target and show all the passes on the screen for comparison.
Once you collect some data, press Pause. You can now move the LMX100 without data scrolling on the screen. When you are ready to resume collecting data, press Resume. You will see a thick, red vertical line, corresponding to when you hit the Pause button and then restarted.
While in Pause mode, press the Exit button to exit data collection and return to the main menu.

Figure 6-5: Pressing Pause and resuming data collection
6.1.4 Clear
Pressing the Clear button will clear all data that was collected. Continue to push the system to acquire new data. If you were in Pause mode, press Resume to continue collecting data
6.1.5 Drawing arrows
Arrows can be drawn on the screen to highlight features. Touch the screen where you want the head of the arrow to appear, and then swipe away in the direction of the shaft. Alternatively, if you just tap the screen, it will insert a vertical arrow pointing up at that position. In the example in Figure 6-6, the user touched near the hyperbolas, then swept their finger towards the top to create the arrows. Touch any arrow to remove it.

Figure 6-6: Drawing arrows on the screen to highlight features
6.l.6 Flags
Flags are often inserted to mark noteworthy surface features, such as poles, sidewalks, changes in terrain etc. These markers may help you correlate subsurface targets with above ground features.
Pressing the asterisk (*) button on the keypad will insert a flag at your current position, either during forward data acquisition or when backed-up. Flags are sequentially numbered (Figure 6-7).

Figure 6-7 Inserting Flags
6.2 LineView Settings
Pressing the LineView Settings button will change the menu at the bottom of the screen, so the user can adjust the way data is viewed on the screen (Figure 6-8). This can be useful for optimizing the appearance of different features.

Figure 6-8 Pressing LineView Settings changes the bottom menu on the screen
6.2.1 Gain
Since the material being scanned absorbs the GPR signal, deeper targets return weaker signals. Gain acts like an audio volume control, amplifying signals and making deeper targets appear stronger in the image. Gain values vary from 1 to 9 where 1 means a minimal amplification has been applied and 9 means that maximum amplification has been applied. Pressing this button increments the gain; once you reach 9 it cycles back to 1. Avoid over-gaining the data as it can make interpretation difficult (Figure 6-9). In general, soils that are more electrically conductive (e.g., clays) will require a higher gain compared to soils that are less electrically conductive (e.g., sand).

Figure 6-9 Varying the Gain
6.2.2 Filter
The Filter is a background subtraction filter used for removing flat-lying responses in the data. Filtering helps identify shallow targets that might be masked by the strong signals at the top of the image, as well as possibly enhancing the visibility of hyperbolas further down in the data. However, it will also filter out other flat-lying responses, such as soil boundaries, so be careful when using this option if your target is flat.
It works by applying a running-average background subtraction to the data set, defined by the filter width or a window. This window “moves” across the data and the result is subtracted for every trace in the data set. The Filter is variable and pressing this button cycles between OFF and values 1 to 5. Variable filter lengths are shown in Figure 6-10.
The lower the number, the longer the filter width, and the more “relaxed” the filter. Only the longer flat-lying features get removed.
The higher the number, the shorter the filter width, and the more “aggressive” the filter. This results in the removal of long and short flat-lying features.
Pressing OFF turns the filter off completely.

Figure 6-10: Showing variable filter lengths, including Filter Off
6.2.3 Zoom
This button controls the horizontal and vertical scaling of the displayed GPR data. Pressing the Zoom button changes the buttons on the bottom menu, which are explained below:
• Depth – Pressing + and – under the Depthbutton allows you to change the display depth of the data. This is commonly referred to as the depth window. The pre-set values range from 1m to 8m (4’ to 30’), see Figure 6-11.
If the data was collected with a shallower depth, the depth setting can still be increased after the fact, when reviewing the data. In general, it’s a good idea to set your displayed depth to 1.5 – 2 times the depth you expect the deepest target to be.
• Position – Pressing + and – under the Position button allows you to change the length of data displayed on a single screen. This is also known as horizontal scaling. The pre-set values range from 10m to 30m (25’ to 100’), see Figure 6-12.
One reason for setting this to 30m would be to fit more data on the screen and look for consistency among hyperbolas that were crossed.

Figure 6-11 Varying displayed depth

Figure 6-12 Varying position, or horizontal scaling
6.2.4 Soil Cal
The Soil Cal (also known as velocity) is a parameter used to ensure that measured depths are accurate. The best way to ensure this is by using the hyperbola-fitting method, since it is based on data collected in the area.
Crossing linear targets like pipes or cables at a 90-degree angle produces a hyperbola suitable for soil calibration. The Soil Cal value obtained will be used to compute a depth estimate of a target. These depths will be incorrect if the soil type is calibrated on a target hyperbola produced at an oblique angle, rather than 90 degrees.
Once you have a hyperbola on the screen from a subsurface target, press Soil Cal. The menu at the bottom of the screen will change, giving you the option of specifying a Soil Type or adjusting the Soil Cal using the hyperbola-fitting method (Figure 6-13). These options are explained below:
• Soil Types – If there are no targets to calibrate to, and you know the type of soil, press this button to vary between the following mediums, with the pre-set Soil Cal value shown in brackets:
• Soil Cal – allows you to use hyperbola-fitting to determine a more accurate Soil Cal. The options are slightly different, depending on whether or not you are in backup mode.
If the back-up indicator is on screen, it is presumed you have backed up the LMX100 and you’re right over the hyperbola. Move the horizontal line to the align with the top of the hyperbola by touching and dragging it. Pressing Soil Cal will display a hyperbola that is locked to the position where the back-up indicator meets the horizontal line (Figure 6-13).

Figure 6-13 Adjusting Soil Cal while in backup mode
On the other hand, if you press Soil Cal while you are collecting data or have pressed Pause, you will see a red hyperbola in the middle of the screen. Drag the hyperbola such that the cross hairs are at the top of a real hyperbola from the ground (Figure 6-14). You can use the 4-way keypad arrows to fine tune the movements.

Figure 6-14 Pressing Soil Cal display red hyperbola (Left). Then move the hyperbola so that it lies over a hyperbola from the ground and adjust the shape (Right)
For either scenario above, once the red hyperbola is properly positioned, you can now use the + and – buttons on the Soil Cal button to widen or tighten the shape. Once the shape is matched (Figure 6-13 and right image of Figure 6-14), you now have the correct Soil Cal and the measured depths will be most accurate. Press Apply to use this value.
If you get a Soil Cal near 300, this could be an Air Wave (Section 5.5), and you should calibrate to a different hyperbolic response.
6.2.5 Color
Pressing this changes the color palette for the GPR Lines. There are 9 different color palette options. Pressing this button increments the color number and re-displays the image; once you reach 9 it cycles back to 1. A few sample color palettes are shown in Figure 6-15.

Figure 6-15 Changing Color palettes
6.2.6 DynaT™
DynaT is a feature that can selectively enhance small, medium or large size targets for easier viewing and detection (Figure 6-16). Pressing DynaT cycles between options: All, Small, Medium and Large. Each option allows the user to enhance part of the ultra-wide band (UWB) spectrum to focus on those desired features.
Selecting Small will show more of the smaller hyperbolas and more detail, whereas Large will focus more on the larger targets with better depth penetration. Selecting All will show a combination of small, medium and large targets.

Figure 6-16 DynaT settings: a) Top left shows All b) Top right set to Small targets c) Bottom left set to Medium targets d) Bottom right set to Large targets
6.3 Saving images as screenshots
Pressing the Camera button will take a screenshot of whatever is on the screen and save this as a .JPG file. See (Section 7) for more details on screenshots and emailing mini-reports
7. Screenshots & Mini-Reports
7.1 Capturing Screens
If you would like to save an image of the current screen press the Camera button on the Display Unit. This saves the screen as a Screenshot image (.JPG), which can be viewed in any third-party viewing software.
If you are not connected to a Wi-Fi network or do not have a sending email address configured, a message appears confirming the filename of the saved image (Figure 7-1).

Figure 7-1 Message displayed after pressing the camera button on the Display Unit to capture the screen (no Wi-Fi present).
If you are connected to a wireless network and have a sending email address configured, the user will see the message in Figure 7-2, asking if you would like to email the screenshot and prompts you to enter the email address. The email address defaults to the last one entered. Tapping on the address box brings up an on-screen keyboard and allows you to enter a new email address. Pressing the “…” button to the left of the email address displays the last 5 email addresses used, allowing the user to easily select a recent email address, rather than re-entering it.
Screenshots can always be e-mailed at a later time from the Screenshot Gallery (Section 7.2).

Figure 7-2 Message after pressing the Camera button on the Display Unit to capture the screen with Wi-Fi enabled and a connection to a wireless network. The user can enter an email address to send the mini-report to.
7.2 Screenshot Gallery
The screenshot gallery allows you to manage all screenshots saved on your LMX100. If you have at least one screenshot saved, you will be able to enter the gallery; otherwise, the Screenshot Gallery button will be greyed out.
Press Screenshot Gallery from the main screen, you will see the image in Figure 7-3.

Figure 7-3: Screenshot Gallery – Tiled View
The number of total screenshots is shown in the bottom middle of the screen.
If you have more than four screenshots saved, you can view the others by either swiping on the screen (right and left) or using the 4-way directional arrows. To select a particular screenshot, touch the screen directly, or use the 4-way directional arrows. From here you have the option to:
• Email – Pressing this will allow you to email the screenshot as a mini-report, provided you’re connected to a Wi-Fi network and have a sending email address saved on the system. You will see the same email prompts as shown in (Section 7.1)
• Expand – This will enlarge the selected screenshot to full screen (Figure 7-4)

Figure 7-4: Screenshot Gallery – Expanded View
Press Tile View to return to the view showing four per page.
• Delete – This will delete the selected screenshot. A confirmation message will appear asking if you want to proceed with this.
• Delete All – This will delete ALL screenshots. A confirmation message will appear asking if you want to proceed with this.
• Exit – this will return you to the main screen. The next time you enter Screenshot Gallery it will show the same view that you left with, Tiled or Expanded.
7.3 Using the Hotspot on your Smartphone
If a Wi-Fi signal in unavailable, you may be able to use your Smartphone as a Wi-Fi access point, by creating a Personal Hotspot. If you are experiencing difficulty connecting to a cell phone Personal Hotspot, ensure that the phone is in discovery mode while connecting. On iPhone (iOS 9.0), for example, this involves going to Settings – Personal Hotspot (Figure 7-5). Ensure that the Personal Hotspot setting is turned on and wait on this screen until the LMX100 connection has been established. Once you have received confirmation on the Display Unit, the cell phone can resume normal use.
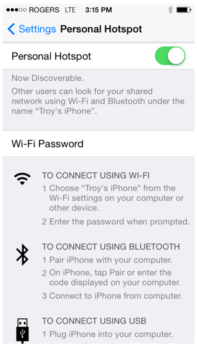
Figure 7-5: Setting Personal Hotspot on an iPhone (iOS 9.0)
Note that when setting up a Personal Hotspot, you may be disconnected from any Wi-Fi networks. Vice-versa, if you have a Personal Hotspot setup, attempting to connect to a Wi-Fi network may disconnect your personal hotspot.
7.4 Mini-Reports
When a screenshot is emailed, it is sent as part of a mini-report. This mini-report also contains a table with information about the collected data including the settings used, date & time (Figure 7-6)


Figure 7-6 Example of a Mini-Report
8. Transferring Data to a PC
Data can be exported to a PC by inserting a USB drive into the USB port (Figure 8-1).

Figure 8-1 Insert a USB memory stick into the USB port on the Display Unit to export data.
Once the USB drive is recognized, a message will appear telling you that a drive has been inserted and if you wish to export your data to it (Figure 8-2). Click Yes.
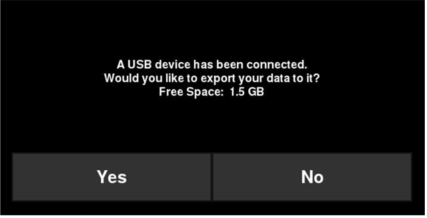
Figure 8-2 When a USB drive is connected to the Display Unit, a message window opens asking if you would like to export all your data to it.
8.1 Formatting USB Sticks
There may be times when a USB stick is not recognized by the LMX100. In this case, you may need to format the USB stick. Ensure that it’s formatted as FAT/FAT32 (NTFS will not work). Also ensure that there are no hidden or write-protected partitions on the USB drive.
If the problem persists after formatting, try another USB stick.
8.2 Directory Structure
The directory structure on the USB drive can be viewed on your PC, and will look as follows:

Each successive export of data will create a new directory called ExportXX, where XX is incremented by 1 from the previous directory.
All screenshots are saved as .JPG files in the Screenshots folder. If the GPS was available during screen capture, those screenshots are geo-tagged and a .kmz file is generated (otherwise the .kmz file is not created). This file can easily be opened in Google EarthTM and shows you the geographic position of those screenshots.

The System Info folder contains an APP.LOG file and a system summary diagnostic report. The APP.LOG file contains important information about system operation and may be requested by Sensors & Software to help troubleshoot any issues. The System Summary report is a PDF file, which lists system usage information, serial numbers and when system tests were done and their pass/fail status. An example file is shown below:


9. Troubleshooting
The LMX100 system is designed to minimize user problems; however, all electronic devices are subject to possible failure. The following are troubleshooting hints which can be referred to if your system fails to operate.
9.1 Screen turns White After Powering Up
If the Display Unit screen turns completely white after powering up the system, the battery does not have enough voltage to completely power the system. Recharge or replace the battery.
9.2 LMX® Does Not Power Up or Sensor Not Detected
If you have connected the cables to the LMX Sensor, Display Unit, and the battery, pressed the Power button on the Display Unit and:
• The Display Unit does not power up, or
• The LMX Sensor is not detected, and you get the following messages:


1) Wait at least 1-minute and see if the Display Unit starts up. Sometimes the Power LED on the Display Unit fails but the Display Unit is otherwise OK. If the application starts but the LED on the Display Unit does not turn on, test the operation of the LED using the System Test > Keypad test under Tools .
9.2.1 Test the battery
• Check that the fuse, inside the battery case, has not blown. If so, replace the 10 Amp fuse with one of the spare fuses inside the battery case.
• Use a multimeter with fine tipped probes (1mm or 0.04 inches) to measure the battery voltage at the connector on the outside of the battery case. Measure the voltage between socket #1 (ground, using the black probe) and socket #4 (power, using the red probe). If the voltage is less than 10.5 volts, there is a problem with the battery.

• If the battery has a low voltage or seems dead, try using another battery (if available), or give the battery a good 12–14-hour charge and try running the system again.
• If the battery does not charge up to 12 Volts or more, it should be replaced.
9.2.2 Test the Battery Cable
Insert the battery cable into the battery and test the battery cable. Use a multimeter to measure the battery voltage at the connector at the end of the battery cable. Measure the voltage between socket #1 (ground, using the black probe) and socket #4 (power, using the red probe). If the voltage is less than 10.5 volts, there is a problem with the battery cable.

9.2.3 Check the LMX Sensor and Display Unit Connectors
Turn off the LMX system and disconnect the battery before disconnecting the cable that connects the Display Unit to the LMX Sensor.
a) On the back of the Display Unit, check that none of the 37 pins are missing, bent, or recessed. Look at the pins on an angle to confirm they are all flush with one another. If one is bent or recessed, gently bend the pin back straight and flush with the other pins. Then reconnect the cable and try powering the LMX system again.

b) Check all 37 sockets at the LMX connector, ensuring that none are blocked with debris. If so, clean out the debris, reconnect the cable and try powering the system again.

9.2.4 Replace the Cable
If you have a spare cable, replace the current cable. If the system does not power on or if the LMX Sensor is not detected with either cable, please contact your GPR supplier for further assistance.
9.2.5 Test the Cable
a) On the end of the cable that connects to the LMX Sensor, check that none of the 37 pins are missing, bent, or recessed. Look at the pins on an angle to confirm they are all flush with one another. If one is bent or recessed, gently bend the pin back straight and flush with the other pins. Connect the cable to the LMX Sensor and try powering the LMX system again.

b) Disconnect the end of the cable that connects to the back of the Display Unit.
c) Check all 37 sockets at the end of the cable, ensuring that none are blocked with debris. If so, clean out the debris, reconnect the cable and try powering the Display Unit again.

d) With the cable connected to the LMX Sensor and the battery connected to the system, check the power from the battery is reaching the Display Unit through the cable by using a multimeter to measure the voltage between socket #21 (ground, using the black probe) and sockets #1 or #2 (power, using the red probe) on the end of the cable. If the voltage is zero, there may be a problem with the cable. If the voltage is at least 10.5 volts, the problem may be the Display Unit. Please contact your GPR supplier for further assistance.

9.3 System Communications
If the battery is OK and the Display Unit turns on, but the GPR sensor does not scan, there may be a communication failure between the Display Unit and the GPR sensor. If an error occurs, an error message will appear. Power Off the system and disconnect the battery.
Make sure the display cable is not damaged, all pins are straight, and there is no dirt or debris in the connector. Ensure that the cable connections are tightly secured. Sometimes vibrations cause the cable connections to slightly loosen and break contact leading to errors. Disconnecting the cable and reconnecting it may provide a better contact and solve the problem. Plug in the battery, turn on the system and try scanning again.
If the Battery, Battery Cable and Display Cable are OK, the problem is either a failure of the Display Unit or the GPR sensor. These units have no user-serviceable parts so they will have to be returned to the vendor for inspection and repair.
9.4 System Overheating
The GPR system is designed to operate to a maximum internal temperature of 70°C or 158°F. In situations of high ambient temperatures or long exposure to direct sun, this maximum internal temperature may be exceeded and cause the system to fail.
If you suspect that the GPR sensor is overheating, shut it off and give it a chance to cool down in a shady location before trying to run it again.
If the situation is such that the high temperatures or direct sun cannot be avoided, it may be a good idea to put some sort of shade over the GPR sensor.
9.5 Display Unit Problem
If the Display Unit does not power up, check the battery power and all cable connections. If that doesn’t work, contact the manufacturer.
9.6 Wobbly Wheels
If, over time, a wheel becomes wobbly, the wheel nut will need to be manually tightened.
For the rear right wheel only (which is connected to the direct drive odometer), insert a large slotted screwdriver into the end of the axle (there’s already a slot there for it) and use a large wrench to slightly tighten the wheel nut. The nut only has to be turned slightly, 1/8th -1/16th of a turn is usually enough. Spin the wheel to make sure it’s still free and not too tight.
9.7 Creating a Test Line for Data Quality
After receiving the system and getting comfortable with its operation, one of the best ways of detecting any problems is to collect a line of data at a convenient, easily accessible location. The line does not have to be too long, but one screen is a good guide. This data line should be saved electronically and perhaps plotted out on paper and dated. If there is a suspected problem with the system, this test line could be collected and compared with earlier tests. When comparing data, take into account weather and environmental conditions, which could skew the comparisons slightly.
9.8 Contacting the Vendor for Service
When returning the system to the Vendor, have the following information available:
1) GPR sensor Serial Number displayed at the top of the System Settings Screen.
2) A brief description of when the error is happening and the operating conditions (temperature, humidity, sunshine, system settings, etc.).
3) Include photos and/or videos to document the occurrence of error messages.
4) APP.LOG file – this is downloaded to your computer during data export
10. Care & Maintenance
10.1 Battery Care
The LMX100 uses a 9-Amp-hour, 12-Volt sealed lead acid battery. It is fused with a 10 Amp fuse to protect it from short circuit damage.
The battery unit should run the LMX100 continuously for 6 hours before recharging is necessary. If long days of data surveying are typical, a second battery unit may be useful.
The battery is strapped onto the cart base and is normally recharged without removing it from the cart. However, the battery can be easily removed for maintenance or for recharging, if required.
If batteries are maintained in a charged condition, they will give long life and reliable service. Improper use and lack of maintenance will greatly reduce their life.
Sealed lead acid batteries should NEVER be left in a discharged condition for any period of time. Charge the batteries as soon as possible after use.
Charge the battery at room temperature whenever possible.
The LMX100 has a voltage monitoring circuit that will turn off the unit when the input voltage drops below 10.5 volts.
If a battery has been deeply discharged or left in a discharged condition for some period of time it may not accept charge immediately when it is connected to the charger (the fast charge light will not illuminate). If the fast charge light does not come on within 6 hours the battery should be considered damaged and should be discarded.
Do not assume that a battery that is still charging after 8 hours is nearing the end of its charge cycle. Typical charging time for an empty battery is 12-14 hours from the start of fast charge.
Ensure that the batteries are fully charged before storing. If practical, store the batteries in a cool place, 10oC, but make sure the temperature is not likely to drop below -30oC or the electrolyte may freeze and possibly split the case.
10.2 Cable Care
With the use of this product in rough, dusty and outdoor environments, users can minimize potential downtime if they care for cables and treat connectors with respect.
1) The cable connectors as well as the connectors on the GPR Sensor and Display Unit need to stay clean and free of dust and moisture. Use a brush or air spray to clean dust, lint and other foreign particles from these connectors.
2) The power and odometer receptacles on the top of the LMX100 are watertight, but do not allow water to get into the receptacle by connecting the battery and odometer cables in the rain
3) After working in rainy conditions, disconnect the cables and check for water in the receptacles. Remove the water or allow to air dry, if necessary. Never allow the system to sit in rainy conditions for long periods of time.
4) When the system is not being used, make sure the connections are protected to prevent dust and moisture from collecting inside. If the connectors are exposed, cover them with some sort of dust cap.
5) Cables and connectors are not designed to suspend or tow or otherwise carry the weight of systems. They are part of the electronic circuit and should be treated accordingly. When not in use they should be placed in their storage box.
10.3 Skid Pads
The bottom of the GPR Sensor is covered with one large wear-resistant skid pad. The skid pad is designed to take the majority of the abrasive wear. If the pad wears down enough, the less-resistant plastic housing may start to wear. If this occurs, it is best to replace the skid pad. It is easily removed with a screwdriver and a new one can be purchased from the vendor.
10.4 Odometer
The odometer should be periodically calibrated (refer to Section Section 4.2.6) to ensure accuracy.
10.5 Storage Cases
Equipment that is transported and stored loosely is more susceptible to damage. All equipment should be stored in its shipping case or a storage box. Sensors & Software has optional shipping cases available for all LMX100 systems.
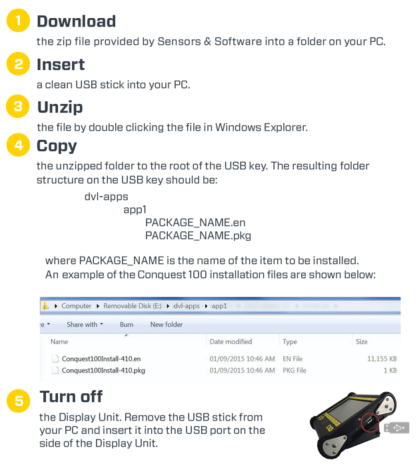
10.6 Upgrading Embedded Software on Display Unit
From time to time, Sensors & Software may release new software for the Display Unit. The instructions below describe how to update this software. Please note that this procedure will erase all GPR data from the system, so export any valuable data before continuing.

11. Parts List & Accessories
11.1 Spare Parts
The following is a list of spare parts available for purchase, with labelled diagram below that:


11.2 Accessories
To see the latest list of LMX100 accessories go to
https://www.sensoft.ca/products/lmx100/accessories/
12. Technical Specifications
The LMX100 technical specifications are available at
https://www.sensoft.ca/products/lmx/lmx-specifications/
Appendix A: Health & Safety Certification
Radio frequency electromagnetic fields may pose a health hazard when the fields are intense. Normal fields have been studied extensively over the past 30 years with no conclusive epidemiology relating electromagnetic fields to health problems. Detailed discussions on the subject are contained in the references at the end of this Appendix.
The USA Federal Communication Commission (FCC) and Occupational Safety and Health Administration (OSHA) both specify acceptable levels for electromagnetic fields. Similar power levels are mandated by corresponding agencies in other countries. Maximum permissible exposures and time duration specified by the FCC and OSHA vary with excitation frequency. The lowest threshold plane wave equivalent power cited is 0.2 mW/cm2 for the general population over the 30 to 300 MHz frequency band. All other applications and frequencies have higher tolerances as shown in graphically in Figure B-1.

Figure B-12 FCC limits for maximum permissible exposure (MPE) plane-wave equivalent power density mW/cm2.
All Sensors & Software Inc. GPR products are normally operated at least 1 m from the user and as such are classified as “mobile” devices according to the FCC. Typical power density levels at a distance of 1 m or greater from any Sensors & Software Inc. products are less than 10-3 mW/cm2 which is 200 to 10,000 times lower than mandated limits. As such, Sensors & Software Inc. products pose no health and safety risk when operated in the normal manner of intended use.
References
1. Questions and answers about biological effects and potential hazards of radio-frequency electromagnetic field.
USA Federal Communications Commission, Office of Engineering & Technology OET Bulletin 56
(Contains many references and web sites)
2. Evaluation Compliance with FCC Guidelines for Human Exposure to Radio Frequency Electromagnetic Fields.
USA Federal Communications Commission, Office of Engineering & Technology OET Bulletin 56
(Contains many references and web sites)
3. USA Occupational Safety and Health Administration regulations paragraph 1910.67 and 1910.263
Appendix B: GPR Emissions, Interference and Regulations
All governments have regulations on the level of electromagnetic emissions that an electronic apparatus can emit. The objective is to assure that one apparatus or device does not interfere with any other apparatus or device in such a way as to make the other apparatus non-functional.
The manufacturer test their GPR products using independent professional testing houses and comply with latest regulations of the USA, Canada, European Community, and other major jurisdictions on the matter of emissions.
Electronic devices have not always been designed for proper immunity. If a GPR instrument is placed in close proximity to an electronic device, interference may occur. While there have been no substantiated reports of interference to date, if any unusual behavior is observed on nearby devices, test if the disturbance starts and stops when the GPR instrument is turned on and off. If interference is confirmed, stop using the GPR.
Where specific jurisdictions have specific GPR guidelines, these are described below.
B-1 FCC Regulations
This device complies with Part 15 of the USA Federal Communications Commission (FCC) Rules. Operation in the USA is subject to the following two conditions:
this device may not cause harmful interference and this device must accept any interference received, including interference that may cause undesired operation.
Part 15 – User Information
This equipment has been tested and found to comply with the limits for a Class A digital device, where applicable, and for an ultra-wide bandwidth (UWB) device where applicable, pursuant to Part 15 of the FCC Rules. These limits are designed to provide reasonable protection against harmful interference when the equipment is operated in a commercial environment. This equipment uses and can radiate radio frequency energy and, if not installed and used in accordance with the instruction manual, may cause harmful interference to radio communications. Operation of this equipment in a residential area is likely to cause harmful interference in which case the user will be required to correct the interference at his/her own expense.
WARNING
Changes or Modifications not expressly approved by the manufacturer could void the user’s authority to operate the equipment.
Certification of this equipment has been carried out using approved cables and peripheral devices. The use of non-approved or modified cables and peripheral devices constitutes a Change or Modification outlined in the warning above.
Operating Restrictions
Operation of this device is limited to purposes associated with law enforcement, firefighting, emergency rescue, scientific research, commercial mining, or construction. Parties operating this equipment must be eligible for licensing under the provisions of Part 90 of this chapter.
FCC Interpretation of Operation Restrictions issued July 12, 2002
(FCC Order DA02-1658, paragraph 9)
The regulations contain restrictions on the parties that are eligible to operate imaging systems (See 47 C.F.R. 5.509(b), 15.511(b), and 15.513(b)). Under the new regulations, GPRs and wall imaging systems may be used only by law enforcement, fire and emergency rescue organizations, by scientific research institutes, by commercial mining companies, and by construction companies. Since the adoption of the Order, we have received several inquiries from the operators of GPRs and wall imaging systems noting that these devices often are not operated by the users listed in the regulations but are operated under contract by personnel specifically trained in the operation of these devices. We do not believe that the recent adoption of the UWB rules should disrupt the critical safety services that can be performed effectively only through the use of GPRs and wall imaging systems. We viewed these operating restrictions in the broadest of terms. For example, we believe that the limitation on the use of GPRs and wall imaging systems by construction companies encompasses the inspection of buildings, roadways, bridges and runways even if the inspection finds no damage to the structure and construction does not actually result from the inspection; the intended purpose of the operation of the UWB device is to determine if construction is required. We also believe that the GPRs and wall imaging systems may be operated for one of the purposes described in the regulations but need not be operated directly by one of the described parties. For example, a GPR may be operated by a private company investigating forensic evidence for a local police department.
FCC Permitted Mode of Usage
The GPR antenna must be kept on the surface to be in compliance with FCC regulations. Use of the antenna is not permitted if it is lifted off the surface. Use as a through-the-wall imaging device is prohibited.
GPR Use Coordination
FCC regulation 15.525(c) (updated in February 2007) requires users of GPR equipment to coordinate the use of their GPR equipment as described below:
TITLE 47–TELECOMMUNICATION
CHAPTER I–FEDERAL COMMUNICATIONS COMMISSION
PART 15_RADIO FREQUENCY DEVICES
Subpart F_Ultra-Wideband Operation Sec.
15.525 Coordination requirements.
(a) UWB imaging systems require coordination through the FCC before the equipment may be used. The operator shall comply with any constraints on equipment usage resulting from this coordination.
(b) The users of UWB imaging devices shall supply operational areas to the FCC Office of Engineering and Technology, which shall coordinate this information with the Federal Government through the National Telecommunications and Information Administration. The information provided by the UWB operator shall include the name, address and other pertinent contact information of the user, the desired geographical area(s) of operation, and the FCC ID number and other nomenclature of the UWB device. If the imaging device is intended to be used for mobile applications, the geographical area(s) of operation may be the state(s) or county(ies) in which the equipment will be operated. The operator of an imaging system used for fixed operation shall supply a specific geographical location or the address at which the equipment will be operated. This material shall be submitted to:
Frequency Coordination Branch, OET
Federal Communications Commission
445 12th Street, SW, Washington, D.C.
20554
Attn: UWB Coordination
(Sensors & Software Inc. Note: The form given on the following page is a suggested format for performing the coordination.)
(c) The manufacturers, or their authorized sales agents, must inform purchasers and users of their systems of the requirement to undertake detailed coordination of operational areas with the FCC prior to the equipment being operated.
(d) Users of authorized, coordinated UWB systems may transfer them to other qualified users and to different locations upon coordination of change of ownership or location to the FCC and coordination with existing authorized operations.
(e) The FCC/NTIA coordination report shall identify those geographical areas within which the operation of an imaging system requires additional coordination or within which the operation of an imaging system is prohibited. If additional coordination is required for operation within specific geographical areas, a local coordination contact will be provided. Except for operation within these designated areas, once the information requested on the UWB imaging system is submitted to the FCC no additional coordination with the FCC is required provided the reported areas of operation do not change. If the area of operation changes, updated information shall be submitted to the FCC following the procedure in paragraph (b) of this section.
(f) The coordination of routine UWB operations shall not take longer than 15 business days from the receipt of the coordination request by NTIA. Special temporary operations may be handled with an expedited turn-around time when circumstances warrant. The operation of UWB systems in emergency situations involving the safety of life or property may occur without coordination provided a notification procedure, similar to that contained in Sec. 2.405(a) through (e) of this chapter, is followed by the UWB equipment user. [67 FR 34856, May 16, 2002, as amended at 68 FR 19751, Apr. 22, 2003]
Effective Date Note: At 68 FR 19751, Apr. 22, 2003, Sec. 15.525 was amended by revising [[Page 925]] paragraphs (b) and (e). This amendment contains information collection and recordkeeping requirements and will not become effective until approval has been given by the Office of Management and Budget.
FCC GROUND PENETRATING RADAR COORDINATION NOTICE
NAME:
ADDRESS:
CONTACT INFORMATION [CONTACT NAME AND PHONE NUMBER]:
AREA OF OPERATION [COUNTIES, STATES OR LARGER AREAS]:
FCC ID: QJQ-NG250
EQUIPMENT NOMENCLATURE: NG250
Send the information to:
Frequency Coordination Branch., OET
Federal Communications Commission
445 12th Street, SW
Washington, D.C. 20554
ATTN: UWB Coordination
Fax: 202-418-1944
INFORMATION PROVIDED IS DEEMED CONFIDENTIAL
B-2 ETSI Regulations for the EC (European Community)
In the European Community (EC), GPR instruments must conform to ETSI (European Technical Standards Institute) standard EN 302 066-1 v1.2.1. Details on individual country requirements for licensing are coordinated with this standard. For more information, contact Sensors & Software’s technical staff.
All Sensors & Software ground penetrating radar (GPR) products offered for sale in European Community countries or countries adhering to ETSI standards are tested to comply with EN 302 066 v1.2.1.
For those who wish to get more detailed information, they should acquire copies of the following documents available from ETSI.
ETSI EN 302 066-1 V1.2.1 (February 2008) Electromagnetic compatibility and Radio spectrum Matters (ERM); Ground and Wall- Probing Radar applications (GPR/WPR) imaging systems; Part 1: Technical characteristics and test methods
ETSI EN 302 066-2 V1.2.1 (February 2008) Electromagnetic compatibility and Radio spectrum Matters (ERM); Ground and Wall- Probing Radar applications (GPR/WPR) imaging systems; Part 2: Harmonized EN covering essential requirements of article 3.2 of the R&TTE Directive
ETSI TR 101 994-2 V1.1.2 (March 2008) Electromagnetic compatibility and Radio spectrum Matters (ERM); Short Range Devices (SRD); Technical characteristics for SRD equipment using Ultra Wide Band technology (UWB); Part 2: Ground- and Wall- Probing Radar applications; System Reference Document
B-3a Industry Canada Regulations – English
Industry Canada published it regulations for ground penetrating radar (GPR) on Mar 29, 2009, as part of the RSS-220 titled ‘Devices Using Ultra-Wideband (UWB) Technology’. Industry Canada has made a unique exception for GPR by not requiring user licensing. The user does have to comply with the following directives:
This Ground Penetrating Radar Device shall be operated only when in contact with or within 1 m of the ground.
This Ground Penetrating Radar Device shall be operated only by law enforcement agencies, scientific research institutes, commercial mining companies, construction companies, and emergency rescue or firefighting organizations.
Should the ground penetrating radar be used in a wall-penetrating mode then the following restriction should be noted by the user:
This In-wall Radar Imaging Device shall be operated where the device is directed at the wall and in contact with or within 20 cm of the wall surface. This In-wall Radar Imaging Device shall be operated only by law enforcement agencies, scientific research institutes, commercial mining companies, construction companies, and emergency rescue or firefighting organizations.
Since operation of GPR is on a license-exempt basis, the user must accept the following:
Operation is subject to the following two conditions: (1) this device may not cause interference, and (2) this device must accept any interference, including interference that may cause undesired operation of the device.
B-3b Règlement d’Industrie Canada – Français
Industrie Canada a publié des règlements pour les appareils géoradar (GPR) le 29 mars 2009, dans le cadre du RSS-220 intitulé “Dispositifs utilisant la bande ultra-large (UWB)”.
Industrie Canada a faite une exception unique pour GPR en n’exigeant pas de licence par utilisateur. L’utilisateur doit se conformer aux directives suivantes:
Ce géoradar périphérique doit être utilisé que lorsqu’il est en contact avec ou moins de 1 m du sol.
Ce géoradar périphérique doit être utilisé que par les organisations d’application de la loi, les instituts de recherche scientifique, des sociétés minières commerciales, entreprises de construction et de secours d’urgence ou des organisations de lutte contre les incendies.
Si le géoradar est utilisé dans un mode de pénétration au mur, la restriction suivante est à noter par l’utili¬sateur:
Ce dispositif d’imagerie radar doit être utilisé lorsque l’appareil est orienté vers le mur et en contact avec ou dans les 20 cm de la surface du mur.
Ce dispositif d’imagerie radar doit être utilisé que par les organisations d’application de la loi, les instituts de recherche scientifique, des sociétés minières commerciales, entreprises de construction et de secours d’urgence ou des organisations de lutte contre les incendies.
Parce que l’exploitation de GPR est sur une base exempte de licence, l’utilisateur doit accepter le texte suivant:
La fonctionnement est soumis aux deux conditions suivantes: (1) cet appareil ne peut pas provoquer d’interférences et (2) cet appareil doit accepter toute interférence, y compris les interférences qui peuvent causer un mauvais fonctionnement du dispositive
Appendix C: Instrument Interference
Immunity regulations place the onus on instrument/apparatus/device manufacturers to assure that extraneous interference will not unduly cause an instrument/apparatus/device to stop functioning or to function in a faulty manner. Based on independent testing house measurements, Sensors & Software Inc. systems comply with such regulations in Canada, USA, European Community and most other jurisdictions. GPR devices can sense electromagnetic fields. External sources of electromagnetic fields such as TV stations, radio stations and cell phones, can cause signals detectable by a GPR which may degrade the quality of the data that a GPR device records and displays.
Such interference is unavoidable but sensible survey practice and operation by an experienced GPR practitioner can minimize such problems. In some geographic areas emissions from external sources may be so large as to preclude useful measurements. Such conditions are readily recognized and accepted by the professional geophysical community as a fundamental limitation of geophysical survey practice. Such interference being present in the GPR recordings is not considered as an equipment fault or as a failure to comply with immunity regulations.
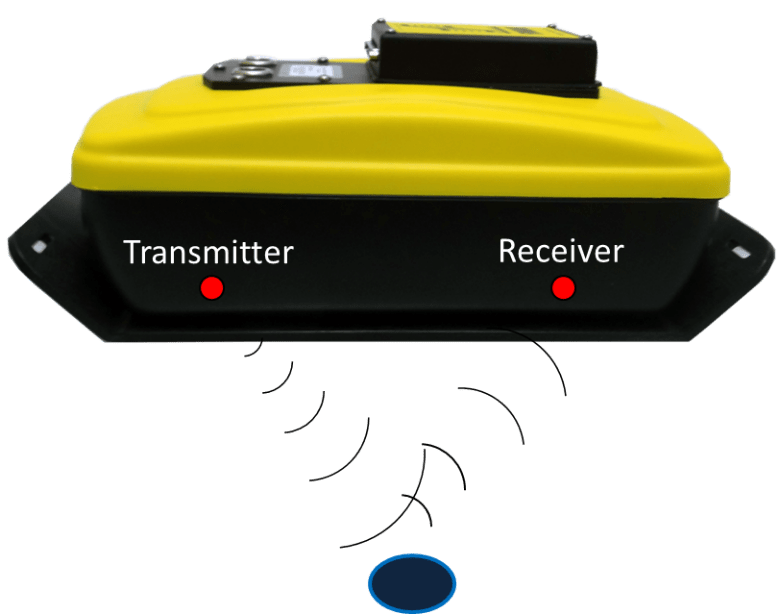
Appendix D: Safety around Explosive Devices
Concerns are expressed from time to time on the hazard of GPR products being used near blasting caps and unexploded ordnance (UXO). Experience with blasting caps indicates that the power of Sensors & Software Inc.’s GPR products is not sufficient to trigger blasting caps. Based on a conservative independent testing house analysis, we recommend keeping the GPR transmitters at least 5 feet (2m) from blasting cap leads as a precaution. Some customers do experimental trials with their particular blasting devices to confirm with safety. We strongly recommend that GPR users routinely working with explosive devices develop a systematic safety methodology in their work areas. The UXO issue is more complex and standards on fuses do not exist for obvious reasons. To date, no problems have been reported with any geophysical instrument used for UXO. Since proximity and vibration are also critical for UXO, the best advice is to be cautious and understand the risks.
Appendix E: Wi-Fi Module
FCC Notice:
NOTE: This equipment has been tested and found to comply with the limits for a Class A digital device, pursuant to part 15 of the FCC Rules. These limits are designed to provide reasonable protection against harmful interference when the equipment is operated in a commercial environment. This equipment generates, uses, and can radiate radio frequency energy and, if not installed and used in accordance with the instruction manual, may cause harmful interference to radio communications. Operation of this equipment in a residential area is likely to cause harmful interference in which case the user will be required to correct the interference at his/her own expense.
Industry Canada Notice:
This device complies with Industry Canada’s license-exempt RSSs. Operation is subject to the following two conditions:
(1) This device may not cause interference; and
(2) This device must accept any interference, including interference that may cause undesired operation of the device.
Request More Information

Languages:
Follow Us


