ithin a few months of its release, the pulseEKKO® Ultra Receiver is already changing the way low frequency GPR data is collected and interpreted. Its ability to collect data 1000 times faster than before allows GPR signals to be stacked tens of thousands of times with no reduction in data acquisition speed. This technology makes it possible to see subtler and deeper GPR features than ever before.
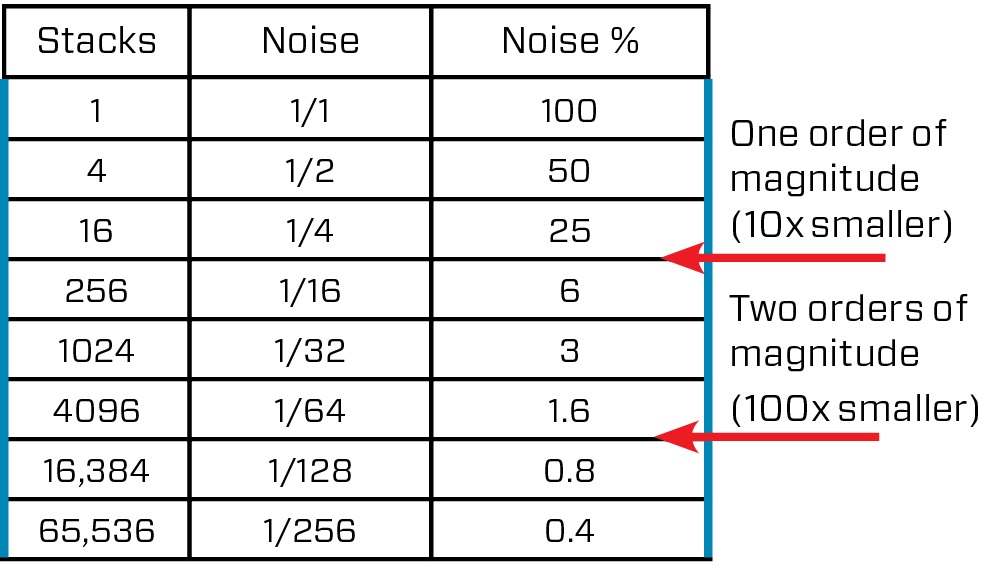
“Stacking” is the term applied when GPR traces are collected multiple times at one location and averaged. Stacking GPR traces many times reduces the random noise floor to 1 / √stacks (Table 1); for example, 65,536 stacks, the highest number of stacks available on the Ultra Receiver, reduces the noise floor to less than 0.5% compared to 1 stack. This means that weak GPR signals, up to about 200 times smaller, are now detectable in GPR data.
The following highlights a few examples of data collected with the pulseEKKO® Ultra Receiver to showcase its abilities, including how it increases the depth of penetration by stacking tens of thousands of times.
Data Example 1 – Petawawa, Ontario, Canada
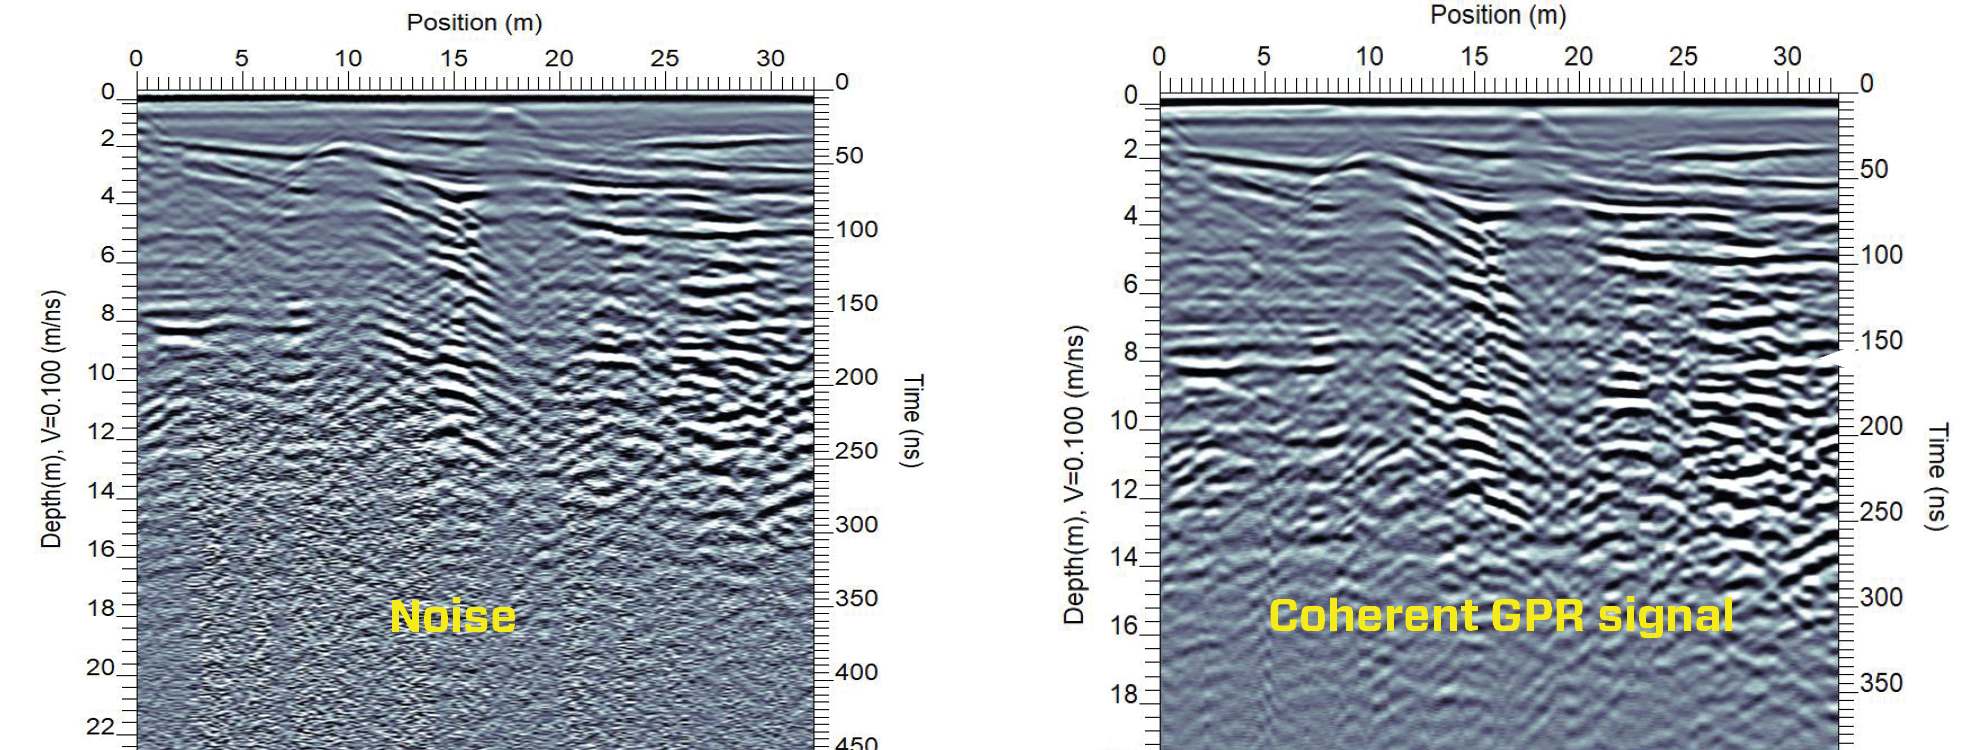
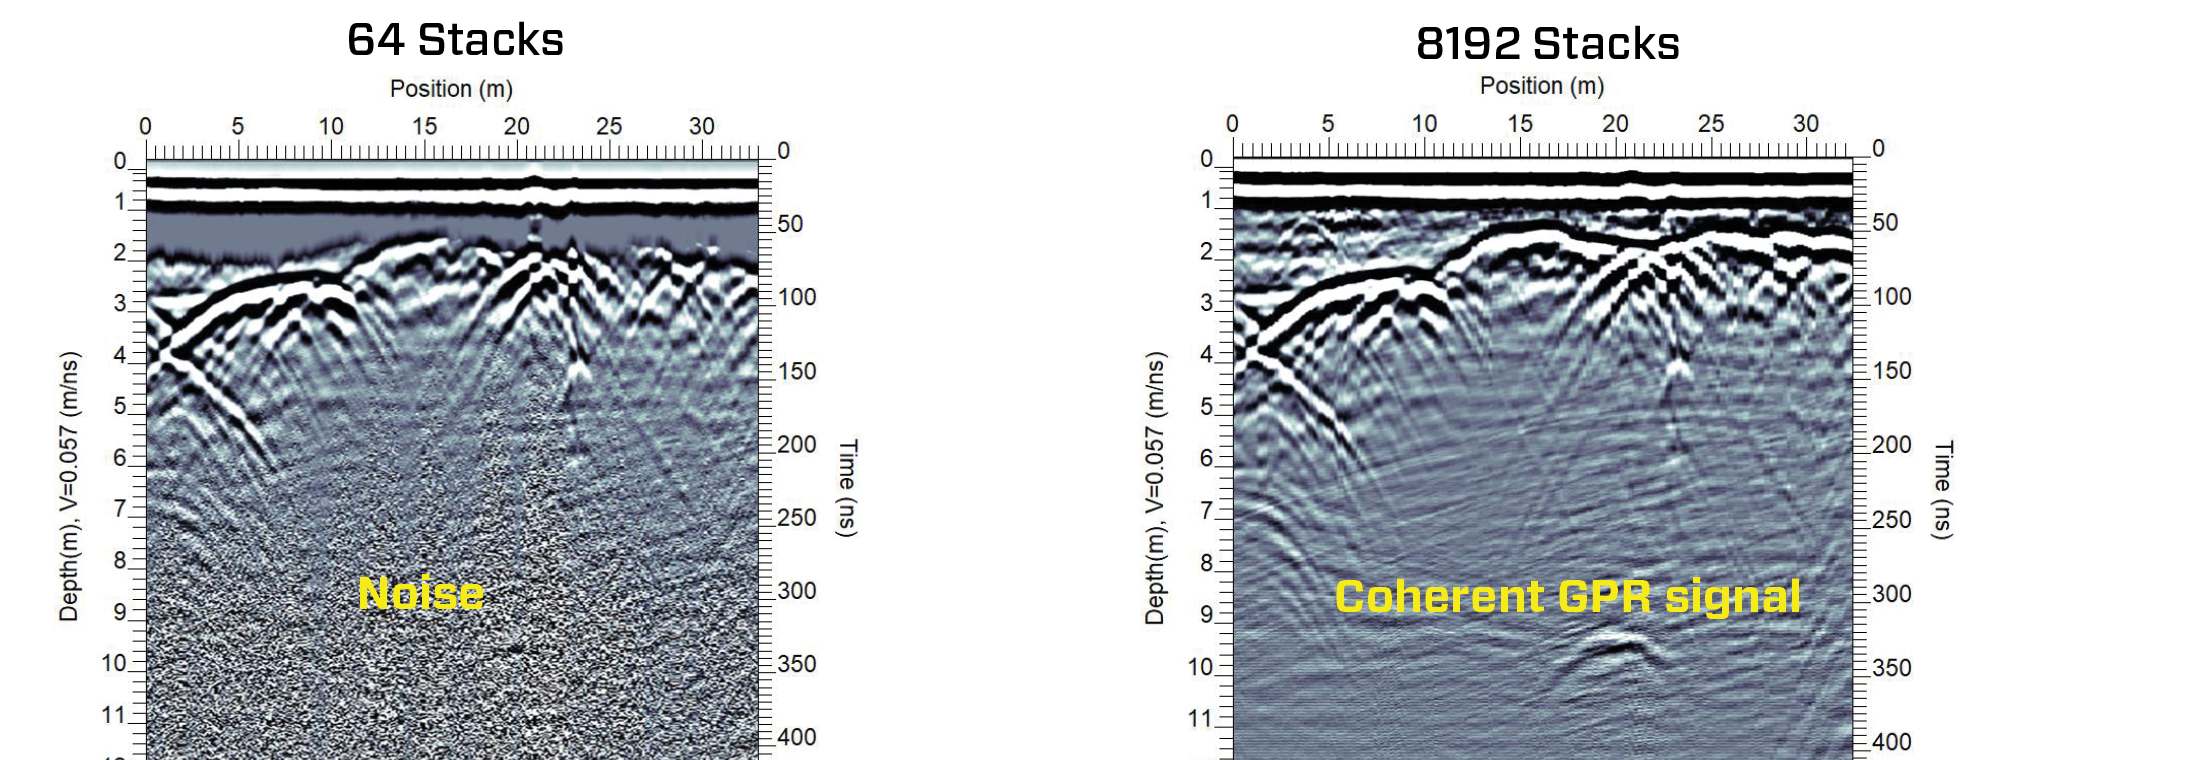
The first data example was collected with a pair of 100 MHz pulseEKKO® antennas in a SmartCart configuration. The area has a high sand content that allows good GPR penetration down to 12+ meters with 64 stacks (Figure 1, left). The random noise is visible starting at 10 or 11 meters depth. By 14 meters depth, the noise dominates the GPR line, making it difficult to see real, coherent GPR reflectors.
The same line was then collected with 8,192 stacks, using the Ultra Receiver (Figure 1, right). It is important to note that the speed of collection of this line with the Ultra Receiver is the same as collection time for 64 stacks on the standard pulseEKKO receiver. This line looks clearer with no random noise and coherent GPR reflections down to 22+ meters.
Based on Table 1, the theory says that increasing the number of stacks from 64 to 8,192 should drop the noise floor by:
(1/√64) / (1/√8192) = 0.125/0.011 = 11.3 times
While the GPR line collected with the higher number of stacks obviously looks better, let’s analyze these lines quantitatively to see how the GPR signals were improved by stacking.
The best way to see the improvement in the signal is by using the Average Trace Amplitude or ATA plot, a type of plot that was discussed in the July 2018 newsletter.
Briefly, an ATA plot shows the average signal level for an entire GPR line, from before the GPR transmitter fires to the end of the time window, after all the GPR signals attenuate back down to the noise floor.
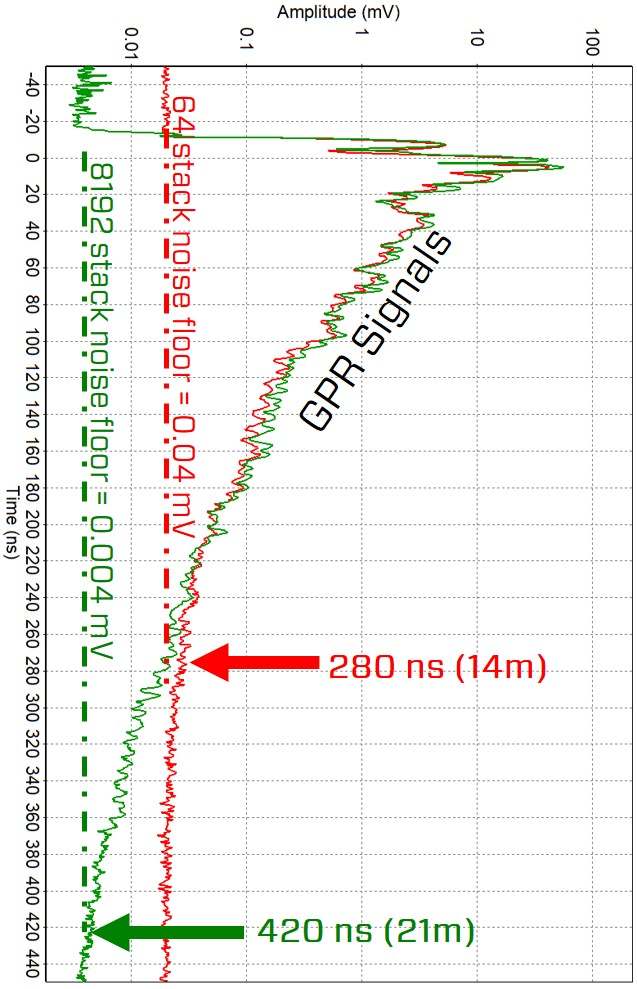
The noise floor is visible as the background signal level before the transmitter fires (vertical red and green lines in Figure 2).
The ATA plots provide information about the random noise floor and the depth of GPR penetration.
Figure 2 shows the noise floor for 64 stacks (vertical red line) is about 0.04 millivolts while the noise floor for 8,192 stacks (vertical green line) is 0.004 mV; this is 10 times smaller – very close to the theoretical value calculated above of 11.3.
The ATA plots in Figure 2 also show the point where the GPR signals attenuate down to the noise floor – this intersection point is the average time (and consequently depth) of GPR signal penetration for the GPR line. In this case, the 64-stack data provides about 280 ns of penetration (about 14 meters depth based on a material velocity of 0.10 m/ns), while the 8,192-stack data has GPR signals down to 420 ns (about 21 meters depth).
Therefore, the penetration increased about 50% by increasing the number of stacks to 8,192.
Data Example 2 – Tampa Bay, Florida, USA
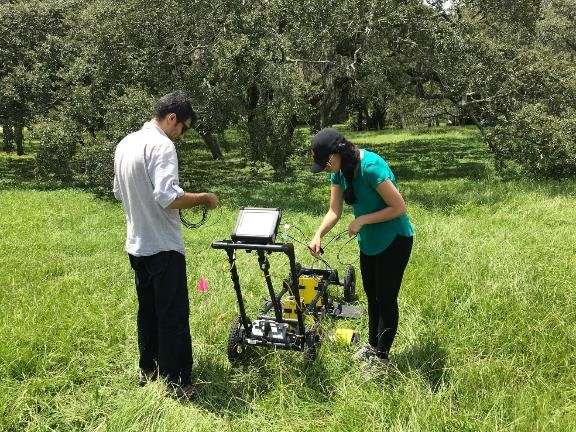
Using 100 MHz pulseEKKO® antennas, a GPR line was collected in the SmartCart configuration, as shown in Figure 3. The data was first stacked 64 times (Figure 4, left); the random noise is visible starting at a depth of 5 meters. By 7 meters depth, the noise dominates the GPR line, making it difficult to see real, coherent GPR reflectors – this is the average depth of penetration for this GPR line.
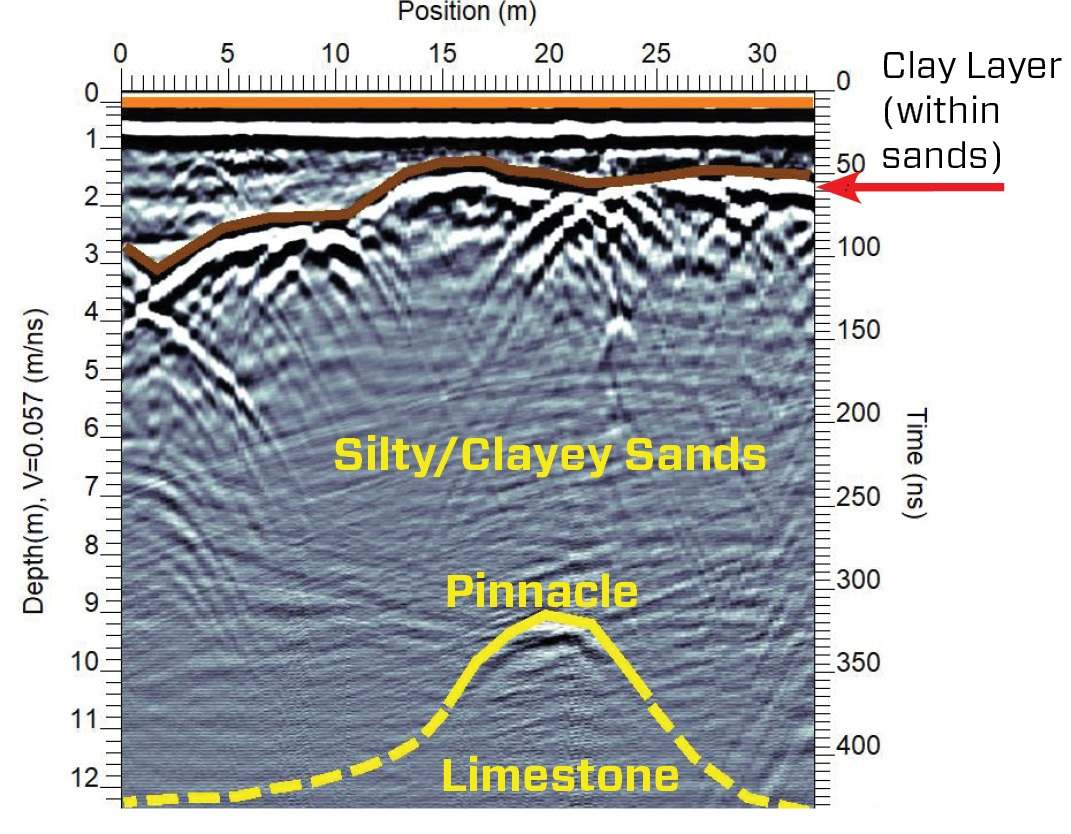
The same line collected with 8,192 stacks, using the Ultra Receiver, is shown in Figure 4, right. The highly stacked line shows a hyperbolic, coherent reflector at a depth of 9.5 meters.
The increased penetration from the increased stacking revealed a deeper reflector that had never been seen in that area before. The geology in that part of Florida is well known and the researchers are interpreting that the Ultra Receiver was able to image a pinnacle in the highly dissolved limestone bedrock, underlying silty-clayey sands (Figure 5).
Again, there was no significant reduction in data collection speed using the Ultra Receiver at 8,192 stacks versus the pulseEKKO® standard receiver at 64 stacks. Previously, high stacking compromised productivity; now, with the Ultra Receiver, the best of both worlds can be achieved.
Data Example 3 – Bandung, Java, Indonesia
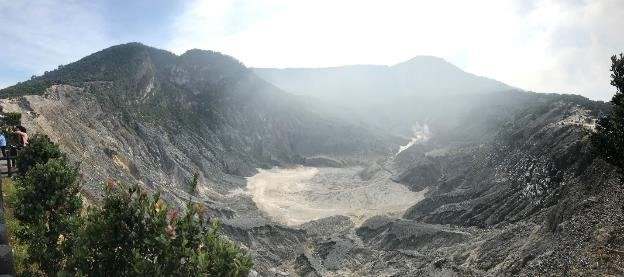
The last data example was collected on the flanks of Tangkuban Perahu, an active volcano with 50 MHz pulseEKKO® antennas.
A 130-meter-long line was collected with 32,768 stacks and it revealed three distinct, large diameter objects, indicated by blue dots in Figure 7.
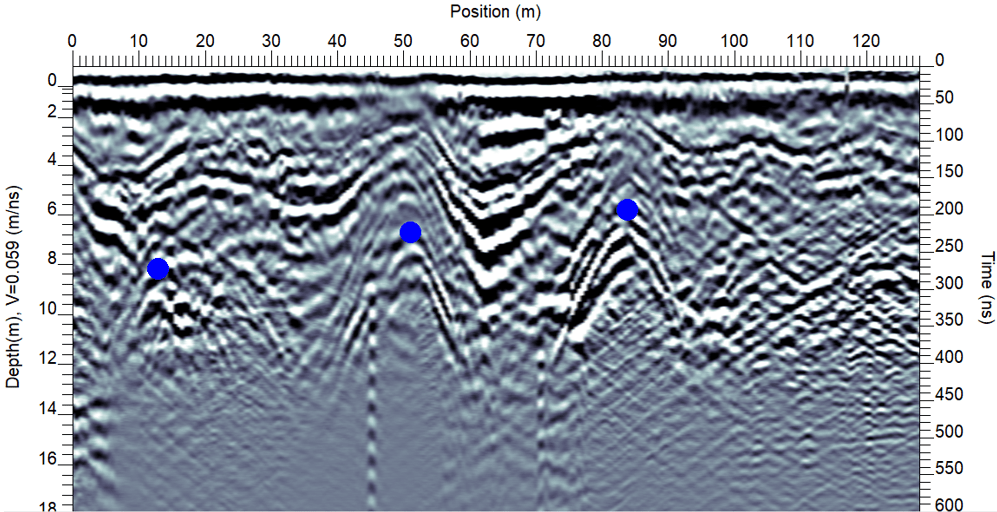
Greatly reducing the random noise makes the GPR reflections image sharper; this means little time is spent processing the GPR data into an interpretable section. In this example, the data was so clear, the volcanologists started their data interpretation out in the field, arguing about the nature of the imaged objects, whether they were a result of lava tubes (Figure 8a) or buried volcanic bombs (Figure 8b).